|
Usually, when you're doing research about groups of people or objects, you will use both descriptive and inferential statistics. Descriptive StatisticsDescriptive statistics refer to the analysis of the data that will help you describe, summarize, or show the data in a way that some patterns might emerge. However, you need to be aware that you shouldn't withdraw conclusions besides the data analyzed. You should be simply describing the data you got. Despite this might not seem important, it really has a crucial part in the process since it allows you to visualize huge data in a simple and effective way. Imagine that you wanted to analyze the performance on a test of 100 students. You might be interested in seeing the overall performance or you might be interested in looking at the spread or distribution of their marks. When you use the descriptive statistics, you should present your data by starting with a table that summarizes the group data, followed by charts and graphs. Finally, at the end, you should add the statistical commentary like the discussion of the results. 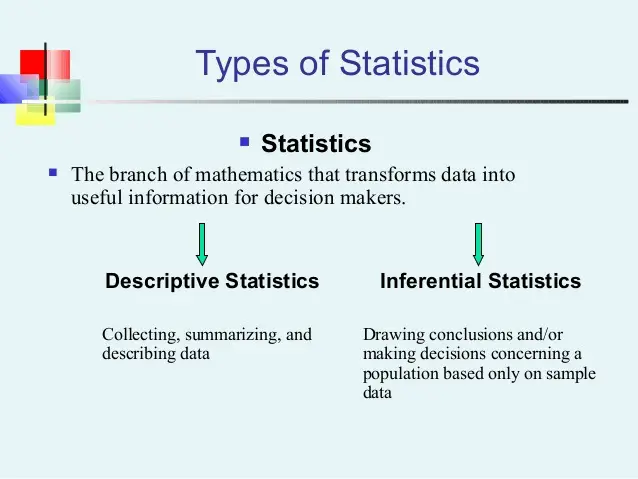 Inferential Statistics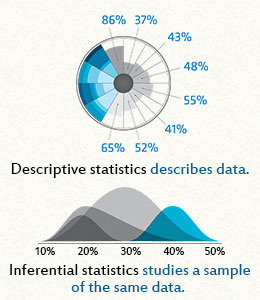 There are many occasions when you want to analyze a specific group but you simply can't have a sample of the entire population. Unlike on the previous example, you wanted to analyze the performance of 100 students, in this case, you might want to measure the performance of all the students in a country. Since it's not doable to collect all the data, you need to choose a smaller sample of students, which will represent all the students in that country.
And this is where the inferential statistics have their crucial role. They refer to the techniques that you use that allow you to use the samples to make generalized comments regarding the entire population. So, as you understand, it's very important to be careful when selecting the sample that represents the population. It needs to be as accurate as it can or the results won't represent the truth. The descriptive and inferential statistics have one thing in common: they both rely on the same data. However, while the descriptive statistics only relies on this particular data, the inferential statistics relies on this data to make general conclusions about a larger population. In order to analyze the data, both descriptive and inferential statistics need to rely on some functions of the data. In the case of the descriptive statistics, it tends to rely on some classic statistics like the mean, standard deviation, min, max, skew, median, and kurtosis. In the case of the inferential statistics, they tend to use some classic statistics like the z score, t score, F-ratio, among others. So, which one should you choose to use? You may need to use both types of statistics and the answer depends on the purpose of your research. For example, when a company is trying to show if a new medicine will be able to help patients in the future, it's in their best interest that they use inferential statistics. If they decide to use descriptive statistics, they won't be able to withdraw any conclusions regarding the population in general but simply regarding the patients that participated in the study.
1 Comment
Abebaw Mebratu
1/14/2023 11:25:01 am
Hi Leave a Reply. |
Z Score Table BlogEverything about normal distribution and Z scores Archives
January 2024
Categories |
 RSS Feed