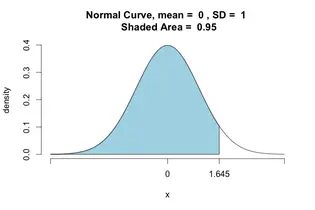
 The z score, also known as the standard score, allows you not only to compare two scores from different normal distributions as it also allows you to calculate the probability of one specific score to occur within the normal distribution. The z score, by taking into account the standard deviation (SD) of the group, standardizes a score with respect to the other scores in the group. When you convert a raw score into a z-score, you'll get a number between 0 (the mean) and 1 (the standard deviation). Basically, what you will be doing is that you'll be defining each score you have in terms of how far away each one is from the group mean. Main Advantages Of Using Z-Scores: There are mainly two advantages why so many different organizations use the z-scores: -- Clarity: At a single glance, you can easily see how bad or good a score is when compared to the entire group. -- Comparison: Being able to compare scores that are measured on different scales is definitely a huge advantage. Results From The Z-Scores: When you are looking at a z-score table, you have three distinct areas: -- The Area Under The Curve: Looking at this part of the table will allow you to see the different properties of the normal distribution. So, you'll be able to see how many scores are under pre-determined limits as well as you'll be able to calculate the probability of a specific score to occur. -- The Area Between The Mean And The Z: This area corresponds to the area under the curve, and that is between the mean and the z-scores. In this area, you can see the proportion of scores that are located between the mean and any given z-score. -- The Area Beyond Z: In this area, you'll see the proportion of the scores that are greater than any given z-score. Calculating The Z-Scores: The easiest way to calculate a z-score is to use a z score calculator. However, in case you're interested in knowing how to calculate it by hand, you just need to find the difference between the score and the mean score, which tells you how far away the score is from the average score, and divide it by the standard deviation. Then you can use a z score table to find a probability. There's no question that is far more effective and time-saving using a z score calculator. 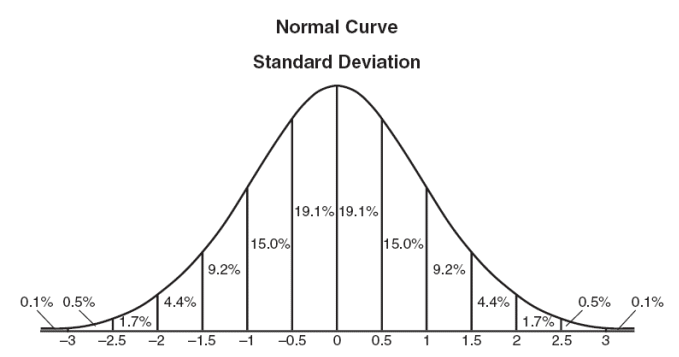
1 Comment
nuhu
5/15/2021 02:51:23 pm
is very good to us we understands Leave a Reply. |
Z Score Table BlogEverything about normal distribution and Z scores Archives
January 2024
Categories |
 RSS Feed