Z SCORE TABLE
Z Table
Z Scores to Percentiles Chart
Z Score Calculator
Z Score Probability Calculator
Interactive Z Table
Z Score Formula
How to calculate the z score
How To Use Z-Score Table
Calculate Z-score
Probability in Statistics
Parameters in Statistics
Percentile Rank
Z Score Chart Basics
History of Normal Distirbution
Statistics Z Score Jokes
When to Use Z Test vs T Test
Z Score Practice Problems
Z Score Problems
Normal Distribution Problems
Confidence Interval Calculator
>
Confidence Interval in Excel
90 confidence interval z score
95 Confidence Interval Z Score
99 Confidence Interval Z Score
Z Score Confidence Interval
Statistics
Statistics Symbols
Statistics Formulas
>
Binomial Coefficient
Empirical Rule
Correlation Coefficient
P Value Calculator
>
P Value Calculator from Z Score
P Value Calculator from T Score
P Value Calculator from Chi-Square
P Value Calculator from F Ratio (ANOVA)
P Value Calculator from Pearson R
P Value Calculator Tukey's Q Score
Cumulative Binomial Probability Calculator
Normal CDF Calculator
>
Normal CDF Formula
Non-normal Distribution
How to find normal cdf ti 84
Examples of Standard Deviation
Sample Standard Deviation on Calculator
Standard Deviation vs Variance
Population vs. Sample
Quantitative vs. Qualitative Data
Formula of Standard Deviation for Grouped Data
Null Hypothesis vs. Alternative Hypothesis
Discrete vs. Continuous Data
Mean vs. Median vs. Mode
Bayesian vs. Frequentist Statistics
What is High Standard Deviation
What Does a Standard Deviation of 0 Mean
Observational Study vs. Experimental Study
Parametric vs. Non-parametric tests
What is 1 Standard Deviation Above the Mean
How to find correlation coefficient on ti 84
How to find linear regression on ti-84
How to find solving equations on ti-84
How to find quadratic regression on ti-84
How to find factorial on ti-84
How to find integrals on ti-84
How to find confidence intervals on ti-84
How to find z-score on ti-84
How to find derivatives on ti-84
How to find summation on ti-84
How to find anova on ti-84
How to find graphing functions on ti-84
How to find factorial on ti-89
How to find integrals on ti-89
How to find standard deviation on ti-89
How to find derivatives on ti-89
How to find linear regression on ti-89
How to find matrix operations on ti-89
How to find summation on ti-89
How to find variance on ti-89
How to find Correlation on TI-Nspire
How to find Variance on TI-Nspire
How to find Standard Deviation on TI-Nspire
What Does a Standard Deviation of 2 Mean
How to find Linear Regression on TI-Nspire
How to find Quadratic Regression on TI-Nspire
How to find Matrix Operations on TI-Nspire
How to find Solving Equations on TI-Nspire
How to find Graphing Functions on TI-Nspire
How to find Integrals on TI-Nspire
How to find Derivatives on TI-Nspire
How to find Summation on TI-Nspire
How to find Factorial on TI-Nspire
How to find Combinations and Permutations on TI-Nspire
How to find Z-Score on TI-Nspire
How to find Probability Distributions on TI-Nspire
How to find ANOVA on TI-Nspire
How to find Histograms on TI-Nspire
How to find Box-and-Whisker Plots on TI-Nspire
How to find Present and Future Value on TI-Nspire
How to find Confidence Intervals on TI-Nspire
Population Standard Deviation and Sample Standard Deviation
Correlation Calculator
>
Covariance vs. Correlation
Dice Roller
Probability Distribution Calculator
Interquartile Range Calculator
Empirical Rule Calculator
Mean, Median and Mode Calculator
Average Calculator
Linear Regression Calculator
Sample Size Calculator
Other Statistical Tables
>
T Value Table
Chi-Square Table
F Distribution Table
Standard Deviation Calculator
Standard Deviation Problems
Normal vs Non-Normal Distribution: Understanding the Differences
Covariance vs. Variance: Understanding the Differences
Explanatory Variable: Understanding Its Role in Statistical Analysis
Independent variable vs dependent
What is a Residual in Statistics?
Left Skewed vs. Right Skewed Distributions
How to Find Variance on ti 84
Real Life Examples of Correlation
What is Regression Analysis?
Statistics Forum
Math
Combination Calculator
How to Calculate a Combination
Combination Formula in Statistics
Permutation Calculator
Distance Between Two Points Calculator
Exploring 7 Unsolvable Math Problems
>
Riemann Hypothesis
Math Problems
>
Math Problems for 1st Graders
Math Problems for 2nd Graders
Math Problems for 3rd Graders
Math Problems for 4th Graders
Math Problems for 5th Graders
Math Problems for 6th Graders
Math Problems for 7th Graders
Math Problems for 8th Graders
Math Problems for 9th Graders
Math Problems for 10th Graders
Math Problems for 11th Graders
Times Tables
>
1 Times Table
2 Times Table
3 Times Table
4 Times Table
5 Times Table
6 Times Table
7 Times Table
8 Times Table
9 Times Table
10 Times Table
Multiplication Tables
>
Multiplication Table by 20
Multiplication Table by 19
Multiplication Table by 18
Multiplication Table by 17
Multiplication Table by 16
Multiplication Table by 15
Multiplication Table by 14
Multiplication Table by 13
Multiplication Table by 12
Multiplication Table by 11
Multiplication Table by 10
Multiplication Table by 9
Multiplication Table by 8
Multiplication Table by 7
Multiplication Table by 6
Multiplication Table by 5
Multiplication Table by 4
Multiplication Table by 3
Roman Numerals Chart
Roman Numerals
>
Roman Numerals Converter
I Roman Numerals
II Roman Numerals
III Roman Numerals
IV Roman Numerals
V Roman Numerals
VI Roman Numerals
VII Roman Numerals
VIII Roman Numerals
IX Roman Numerals
X Roman Numerals
XI Roman Numerals
XII Roman Numerals
XIII Roman Numerals
XIV Roman Numerals
XV Roman Numerals
XVI Roman Numerals
XVII Roman Numerals
XVIII Roman Numerals
LXVI Roman Numerals
LXVII Roman Numerals
LXVIII Roman Numerals
LXIX Roman Numerals
LXX Roman Numerals
LXXI Roman Numerals
LXXII Roman Numerals
LXXIII Roman Numerals
LXXIV Roman Numerals
LXXV Roman Numerals
LXXVI Roman Numerals
LXXVII Roman Numerals
LXXVIII Roman Numerals
LXXIX Roman Numerals
LXXX Roman Numerals
LXXXI Roman Numerals
LXXXII Roman Numerals
LXXXIII Roman Numerals
LXXXIV Roman Numerals
LXXXV Roman Numerals
LXXXVI Roman Numerals
LXXXVII Roman Numerals
LXXXVIII Roman Numerals
LXXXIX Roman Numerals
XC Roman Numerals
XCI Roman Numerals
XCII Roman Numerals
XCIII Roman Numerals
XCIV Roman Numerals
XCV Roman Numerals
XCVI Roman Numerals
XCVII Roman Numerals
XCVIII Roman Numerals
XCIX Roman Numerals
C Roman Numerals
CI Roman Numerals
CII Roman Numerals
CIII Roman Numerals
CIV Roman Numerals
CV Roman Numerals
CVI Roman Numerals
CVII Roman Numerals
CVIII Roman Numerals
CIX Roman Numerals
CX Roman Numerals
CXI Roman Numerals
CXII Roman Numerals
CXIII Roman Numerals
CXIV Roman Numerals
CXV Roman Numerals
CXVI Roman Numerals
CXVII Roman Numerals
CXVIII Roman Numerals
CXIX Roman Numerals
CXX Roman Numerals
CXXI Roman Numerals
CXXII Roman Numerals
CXXIII Roman Numerals
CXXIV Roman Numerals
CXXV Roman Numerals
CXXVI Roman Numerals
CXXVII Roman Numerals
CXXVIII Roman Numerals
CXXIX Roman Numerals
CXXX Roman Numerals
CXXXI Roman Numerals
CXXXII Roman Numerals
CXXXIII Roman Numerals
CXXXIV Roman Numerals
CXXXV Roman Numerals
CXXXVI Roman Numerals
CXXXVII Roman Numerals
CXXXVIII Roman Numerals
CXXXIX Roman Numerals
CXL Roman Numerals
CXLI Roman Numerals
CXLII Roman Numerals
CXLIII Roman Numerals
CXLIV Roman Numerals
CXLV Roman Numerals
CXLVI Roman Numerals
CXLVII Roman Numerals
CXLVIII Roman Numerals
CXLIX Roman Numerals
CL Roman Numerals
CLI Roman Numerals
CLII Roman Numerals
CLIII Roman Numerals
CLIV Roman Numerals
CLV Roman Numerals
CLVI Roman Numerals
CLVII Roman Numerals
CLVIII Roman Numerals
CLIX Roman Numerals
CLX Roman Numerals
CLXI Roman Numerals
CLXII Roman Numerals
CLXIII Roman Numerals
CLXIV Roman Numerals
CLXV Roman Numerals
CLXVI Roman Numerals
CLXVII Roman Numerals
CLXVIII Roman Numerals
CLXIX Roman Numerals
CLXX Roman Numerals
CLXXI Roman Numerals
CLXXII Roman Numerals
CLXXIII Roman Numerals
CLXXIV Roman Numerals
CLXXV Roman Numerals
CLXXVI Roman Numerals
CLXXVII Roman Numerals
CLXXVIII Roman Numerals
CLXXIX Roman Numerals
CLXXX Roman Numerals
CLXXXI Roman Numerals
CLXXXII Roman Numerals
CLXXXIII Roman Numerals
CLXXXIV Roman Numerals
CLXXXV Roman Numerals
CLXXXVI Roman Numerals
CLXXXVII Roman Numerals
CLXXXVIII Roman Numerals
CLXXXIX Roman Numerals
CXC Roman Numerals
CXCI Roman Numerals
CXCII Roman Numerals
CXCIII Roman Numerals
CXCIV Roman Numerals
CXCV Roman Numerals
CXCVI Roman Numerals
CXCVII Roman Numerals
CXCVIII Roman Numerals
CXCIX in Roman Numerals
CC Roman Numerals
3 in Roman Numerals
4 in Roman Numerals
5 in Roman Numerals
6 in Roman Numerals
7 in Roman Numerals
8 in Roman Numerals
9 in Roman Numerals
10 in Roman Numerals
11 in Roman Numerals
12 in Roman Numerals
13 in Roman Numerals
14 in Roman Numerals
15 in Roman Numerals
16 in Roman Numerals
18 in Roman Numerals
19 in Roman Numerals
20 in Roman Numerals
22 in Roman Numerals
30 in Roman Numerals
50 in Roman Numerals
100 in Roman Numerals
500 in Roman Numerals
1000 in Roman Numerals
SAMPLE
>
TEMP XVII Roman Numerals
Percentage Increase Calculator
Linear Equations
>
Two-Variable Linear Equations Test with Answers
One Variable Linear Equations
>
Ax=B Linear Equation Calculator
Ax=B Linear Equation Practice Test
Decimal Places Value Chart
Cone Volume Calculator
Circumference Calculator
Rounding Calculator
>
Round 15 to the nearest ten
Round 75 to the nearest ten
Round 35 to the nearest ten
Round 5 to the nearest ten
Round 3 to the Nearest Ten
Factor Calculator
>
Factor of 36
Factor of 30
Factor of 32
Factor of 35
Factor of 39
Factor of 33
Factor of 34
Factor of 3
Factor of 3/4
Factor of 38
Radius of a Circle
Fraction Calculator
Perfect Square Calculator
>
Is 1 a perfect square
Is 2 a perfect square
Is 8 a perfect square
Is 9 a perfect square
Is 16 a perfect square
Is 20 a perfect square
Is 36 a perfect square
Is 49 a perfect square
Is 81 a perfect square
Is 125 a perfect square
Random Number Generator
>
Random and Pseudorandom Numbers
What is Random Number
Horizontal Line
X and Y Axis
Margin Calculator
Simple Interest Calculator
Sig Fig Calculator
Right Triangle Calculator
Money Counter
Root Calculator
Table of Square Roots
Square Root Calculator
>
Square root of 2
Square root of 8
Square root of 5
Square root of 4
Square root of 3
Square root of 64
Square root of 10
Square root of 16
Square root of 25
Square root of 12
Square root of 50
Square root of 20
Square root of 9
Square root of 100
Square root of 36
Square root of 6
Square root of 49
Square root of 1
Square root of 32
Square root of 40
Square root of 81
Square root of 18
Square root of 72
Square root of 13
Square root of 80
Square root of 45
Log Calculator
Inequality Symbols
Exponent calculator
Decimal to Fraction Calculator
Fraction to Percent Calculator
Scale Factor
Unit Conversion
Celsius to Fahrenheit Converter
>
-40 C to F
10 C to F
15 C to F
22 C to F
30 C to F
37 C to F
40 C to F
Fahrenheit to Celsius Converter
>
-40 F to C
17 Fahrenheit to Celsius
18 Fahrenheit to Celsius
19 Fahrenheit to Celsius
20 Fahrenheit to Celsius
23 Fahrenheit to Celsius
26 Fahrenheit to Celsius
27 Fahrenheit to Celsius
28 Fahrenheit to Celsius
37 Fahrenheit to Celsius
40 F to C
60 F to C
68 F to C
69 F to C
70 F to C
72 F to C
75 F to C
80 F to C
90 F to C
100 F to C
180 F to C
220 F to C
350 F to C
Weight conversion table kg to lbs
Kilograms to Pounds Converter
>
1 kg to lbs
2 kg to lbs
3 kg to lbs
4 kg to lbs
6 kg to lbs
8 kg to lbs
10 kg to lbs
12 kg to lbs
15 kg to lbs
16 kg to lbs
20 kg to lbs
23 kg to lbs
25 kg to lbs
30 kg to lbs
40 kg to lbs
45 kg to lbs
50 kg to lbs
53 kg to lbs
56 kg to lbs
57 kg to lbs
58 kg to lbs
59 kg to lbs
60 kg to lb
62 kg to lbs
63 kg to lbs
64 kg to lbs
65 kg to lbs
67 kg to lbs
68 kg to lbs
70 kg to lbs
72 kg to lbs
73 kg to lbs
74 kg to lbs
75 kg to lbs
76 kg to lbs
78 kg to lbs
80 kg to lbs
82 kg to lbs
84 kg to lbs
85 kg to lbs
90 kg to lbs
95 kg to lbs
150 kg to lbs
100 kg to lbs
Pounds to Kilograms Converter
>
1-10 LB to KG
>
1.25 lb to kg
2.25 lb to kg
3.75 lb to kg
1.75 lb to kg
1.56 lb to kg
5.25 lb to kg
2.75 lb to kg
1.87 lb to kg
1.65 lb to kg
2.87 lb to kg
0.75 lb to kg
0.75 lb to kg
1.1 lb to kg
1.21 lb to kg
1.32 lb to kg
3.25 lb to kg
1.55 lb to kg
2.65 lb to kg
1.37 lb to kg
0.55 lb to kg
1.85 lb to kg
2.15 lb to kg
1.14 lb to kg
3.31 lb to kg
0.88 lb to kg
1.15 lb to kg
5.29 lb to kg
0.45 lb to kg
4.75 lb to kg
0.85 lb to kg
0.95 lb to kg
5.11 lb to kg
0.44 lb to kg
1.82 lb to kg
2.85 lb to kg
0.68 lb to kg
1.13 lb to kg
0.05 lb to kg
2.47 lb to kg
3.85 lb to kg
4.23 lb to kg
1.38 lb to kg
2.91 lb to kg
4.12 lb to kg
2.95 lb to kg
5.73 lb to kg
2.99 lb to kg
1.78 lb to kg
3.35 lb to kg
1.92 lb to kg
1.58 lb to kg
5.51 lb to kg
1.28 lb to kg
0.02 lb to kg
1.42 lb to kg
0.89 lb to kg
1.16 lb to kg
1.99 lb to kg
1.69 lb to kg
2.17 lb to kg
1 lb to kg
1.6 lb to kg
2 lb to kg
3 lb to kg
4 lb to kg
5 lb to kg
6 lb to kg
7 lb to kg
8 lb to kg
9 lb to kg
10 lb to kg
11 lb to kg
12 lb to kg
12.5 lb to kg
13 lb to kg
14 lb to kg
15 lb to kg
16 lb to kg
17 lb to kg
18 lb to kg
19 lb to kg
20 lb to kg
21 lb to kg
22 lb to kg
23 lb to kg
24 lb to kg
25 lb to kg
26 lb to kg
27 lb to kg
28 lb to kg
29 lb to kg
30 lb to kg
31 lb to kg
32 lb to kg
33 lb to kg
35 lb to kg
40 lb to kg
45 lb to kg
50 lb to kg
55 lb to kg
60 lb to kg
70 lb to kg
90 lb to kg
98 lb to kg
99 lb to kg
100 lb to kg
130 lb to kg
150 lb to kg
Fluid Ounces to Milliliters
Kilometers to Miles Converter
>
1 kilometer to miles
5 km to miles
10 km to miles
15 km to miles
20 km to miles
50 km to miles
100 km to miles
Miles to Kilometers Conversion
>
1 mile to kilometers
5 miles to km
10 miles to km
15 miles to km
20 miles to km
KPH to MPH Converter
>
30 kph to mph
45 kph to mph
60 kph to mph
70 kph to mph
75 kph to mph
90 kph to mph
100 kph to mph
110 kph to mph
120 kph to mph
130 kph to mph
140 kph to mph
150 kph to mph
155 kph to mph
160 kph to mph
165 kph to mph
180 kph to mph
200 kph to mph
210 kph to mph
220 kph to mph
240 kph to mph
250 kph to mph
260 kph to mph
270 kph to mph
280 kph to mph
300 kph to mph
320 kph to mph
360 kph to mph
400 kph to mph
600 kph to mph
800 kph to mph
Inches to Millimeters Converter
>
1 inch to mm
1.5 inches to mm
2 inches to mm
2.5 inches to mm
3 inches to mm
4 inches to mm
5 inches to mm
6 inches to mm
18 inches to mm
34 inches to mm
160 inches to mm
Millimeters to Inches Converter
>
1 mm to inches
1.5 mm to inches
2 mm to inches
2.5 mm to inches
3 mm to inches
3.5 mm to inches
4 mm to inches
4.5 mm to inches
5 mm to inches
6 mm to inches
8 mm to inches
10 mm to inches
Meters to Feet Converter
>
1 Meter to Feet
2 Meters to Feet
3 Meters to Feet
5 Meters to Feet
10 Meters to Feet
20 Meters to Feet
30 Meters to Feet
50 Meters to Feet
100 Meters to Feet
Centimeters to Inches Converter
>
2 cm to inches
3 cm to inches
5 cm to inches
8 cm to inches
10 cm to inches
12 cm to inches
14 cm to inches
15 cm to inches
17 cm to inches
18 cm to inches
20 cm to inches
21 cm to inches
25 cm to inches
28 cm to inches
30 cm to inches
35 cm to inches
40 cm to inches
50 cm to inches
60 cm to inches
36 cm to inches
45 cm to inches
70 cm to inches
80 cm to inches
90 cm to inches
100 cm to inches
120 cm to inches
150 cm to inches
Centimeters to Feet Converter
>
150 cm to feet
160 cm to feet
162 cm to feet
163 cm to feet
164 cm to feet
165 cm to feet
170 cm to feet
172 cm to feet
173 cm to feet
175 cm to feet
178 cm to feet
180 cm to feet
182 cm to feet
183 cm to feet
185 cm to feet
190 cm to feet
Watts to Amps Calculator
>
500 Watts to Amps
800 Watts to Amps
1000 Watts to Amps
1200 Watts to Amps
1500 Watts to Amps
2500 Watts to Amps
3000 Watts to Amps
5000 Watts to Amps
MCG to MG Converter
>
5 mcg to mg
10 mcg to mg
50 mcg to mg
100 mcg to mg
125 mcg to mg
200 mcg to mg
250 mcg to mg
300 mcg to mg
400 mcg to mg
500 mcg to mg
1000 mcg to mg
Date & Time
Time Duration Calculator
Time Conversion Chart
Military Times Chart
Military Time Now Clock
Military Time Converter
GMT Time Clock
Time Zone
Age Calculator
Test Prep
CFA Exam Overview
>
How to Prepare for CFA level 1: An Actionable Study Guide
20 CFA Level 1 Practice Questions
CFA Practice Questions for level 1
30 CFA Level 1 Practice Questions
CFA Level 2 Practice Exam Questions
CFA Sample Practice Questions | Level 3| Answers and Explanations
CFA Exam Requirements
CFA Level 3 Salary
SAT Practice Test Math
Math Practice Test HiSET
Acing the SAT: A Comprehensive and Actionable Study Guide
GMAT Practice Questions Math with Answers and Explanations
GMAT Math Formulas Sheet
Math Practice Test for GED with Answers and Explanations
Math Problems to Solve | Practice Test
Free Practice TEAS Test
GRE Practice Math Questions | Free | Answers & Explanations
Formulas for GRE Math Section
ACT Practice Test with Answers and Explanations
CPA Practice Questions
ASVAB Practice Test
IQ Test
How many hours to study for CPA
How to Excel in Your CPA Exams: A Comprehensive Preparation Guide
Blog
Contact Us
Advertise Here
Privacy Policy
Useful Calculators and Converters
Español
XVIII Roman Numerals
XIX Roman Numerals
XX Roman Numerals
XXI Roman Numerals
XVIII Roman Numerals
XXII Roman Numerals
XXIII Roman Numerals
XXIV Roman Numerals
XXV Roman Numerals
XXVI Roman Numerals
XXVII Roman Numerals
XXVIII Roman Numerals
XXIX Roman Numerals
XXX Roman Numerals
XXXI Roman Numerals
XXXII Roman Numerals
XXXIII Roman Numerals
XXXIV Roman Numerals
XXXV Roman Numerals
XXXVI Roman Numerals
XXXVII Roman Numerals
XXXVIII Roman Numerals
XXXIX Roman Numerals
XL Roman Numerals
XLI Roman Numerals
XLII Roman Numerals
XLIII Roman Numerals
XLIV Roman Numerals
XLV Roman Numerals
XLVI Roman Numerals
XLVII Roman Numerals
XLVIII Roman Numerals
XLIX Roman Numerals
L Roman Numerals
LI Roman Numerals
LII Roman Numerals
LIII Roman Numerals
LIV Roman Numerals
LV Roman Numerals
LVI Roman Numerals
LVII Roman Numerals
LVIII Roman Numerals
LIX Roman Numerals
LX Roman Numerals
LXI Roman Numerals
LXII Roman Numerals
LXIII Roman Numerals
LXIV Roman Numerals
LXV Roman Numerals
XVIII Roman Numerals
TEMP XVII Roman Numerals
XVIII Roman Numerals
>
TEMP XVII Roman Numerals
Mole Calculator
BMI Calculator
Tic Tac Toe
100s Chart -Printable
Online Timer
Online Stopwatch
How Many Days Until Chritmas
Simple Interest Formula Explained
Understanding Simple Interest vs. Compound Interest
10 Real-World Simple Interest Examples
20 Simple Interest Problems
Compound Interest Practice Problems
34 lb to kg
36 lb to kg
37 lb to kg
38 lb to kg
39 lb to kg
41 lb to kg
42 lb to kg
43 lb to kg
44 lb to kg
46 lb to kg
47 lb to kg
48 lb to kg
49 lb to kg
51 lb to kg
52 lb to kg
53 lb to kg
54 lb to kg
56 lb to kg
57 lb to kg
58 lb to kg
59 lb to kg
61 lb to kg
62 lb to kg
63 lb to kg
64 lb to kg
65 lb to kg
Home
›
Z Table
›
How to Use the Z-Score Table
How to Use the Z-Score Table
Here you can find a detailed step-by-step explanation on how you can use the z-score table (also referred as the standard normal table) to find the area (probability) corresponding to a specific z-score.
EXAMPLE
50 randomly selected volunteers took an IQ test. Helen, one of the volunteers, scored 74 (X) from maximum possible 120 points. The average score was 62 (µ) and the standard deviation was 11 (σ). How well did she do on the test compared to other volunteers?
STEP 1: Convert to a z-score
In order to find out how well Helen did, her IQ test points need to be converted to a standardized z-score using the following formula:
In our example: (74 – 62) / 11 = 1.09090909. We can round this number to 1.09 which is the standardized score (same as z-score) that we are going to use.
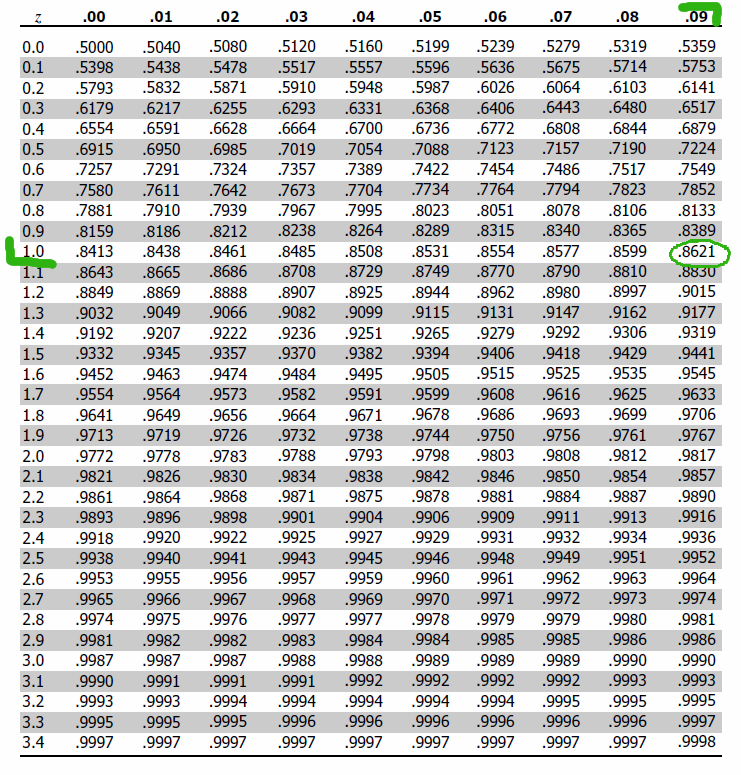
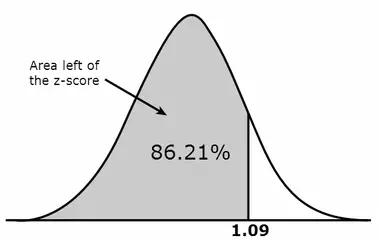
STEP 2: Find the area corresponding to the z-score
After calculating the standardized score, we need to look up the area (same as probability) using the z-table. First, we find the first two digits on the left side of the z-table. In this case it is 1.0. Then, we look up a remaining number across the table (on the top) which is 0.09 in our example. The corresponding area is 0.8621 which translates into 86.21%. On some z-tables you will find that the area corresponding to 1.09 z-score is 0.3621. Don’t be confused. Such tables just show the area to the right and the left of the mean. This means that for positive values you need to add 0.5 (i.e. 50%) to calculate the area to the left of a z-score. And indeed: 0.5 + 0.3621 = 0.8621.
STEP 3: Draw a valid conclusion
The area that we looked up in the z-table suggests that Helen received a better score than 86% of the volunteers who took the IQ test. If you would like to know an exact number of people who Helen outperformed at the test, then just multiply 50 (remember that’s how many people took the test) by 0.8621 which is 43.1. As there are no partial human beings, we just round the number to 43. Helen did better than other 43 test takers.
Z Table
Z Scores to Percentiles Chart
Z Score Calculator
Z Score Probability Calculator
Interactive Z Table
Z Score Formula
How to calculate the z score
How To Use Z-Score Table
Calculate Z-score
Probability in Statistics
Parameters in Statistics
Percentile Rank
Z Score Chart Basics
History of Normal Distirbution
Statistics Z Score Jokes
When to Use Z Test vs T Test
Z Score Practice Problems
Z Score Problems
Normal Distribution Problems
Confidence Interval Calculator
>
Confidence Interval in Excel
90 confidence interval z score
95 Confidence Interval Z Score
99 Confidence Interval Z Score
Z Score Confidence Interval
Statistics
Statistics Symbols
Statistics Formulas
>
Binomial Coefficient
Empirical Rule
Correlation Coefficient
P Value Calculator
>
P Value Calculator from Z Score
P Value Calculator from T Score
P Value Calculator from Chi-Square
P Value Calculator from F Ratio (ANOVA)
P Value Calculator from Pearson R
P Value Calculator Tukey's Q Score
Cumulative Binomial Probability Calculator
Normal CDF Calculator
>
Normal CDF Formula
Non-normal Distribution
How to find normal cdf ti 84
Examples of Standard Deviation
Sample Standard Deviation on Calculator
Standard Deviation vs Variance
Population vs. Sample
Quantitative vs. Qualitative Data
Formula of Standard Deviation for Grouped Data
Null Hypothesis vs. Alternative Hypothesis
Discrete vs. Continuous Data
Mean vs. Median vs. Mode
Bayesian vs. Frequentist Statistics
What is High Standard Deviation
What Does a Standard Deviation of 0 Mean
Observational Study vs. Experimental Study
Parametric vs. Non-parametric tests
What is 1 Standard Deviation Above the Mean
How to find correlation coefficient on ti 84
How to find linear regression on ti-84
How to find solving equations on ti-84
How to find quadratic regression on ti-84
How to find factorial on ti-84
How to find integrals on ti-84
How to find confidence intervals on ti-84
How to find z-score on ti-84
How to find derivatives on ti-84
How to find summation on ti-84
How to find anova on ti-84
How to find graphing functions on ti-84
How to find factorial on ti-89
How to find integrals on ti-89
How to find standard deviation on ti-89
How to find derivatives on ti-89
How to find linear regression on ti-89
How to find matrix operations on ti-89
How to find summation on ti-89
How to find variance on ti-89
How to find Correlation on TI-Nspire
How to find Variance on TI-Nspire
How to find Standard Deviation on TI-Nspire
What Does a Standard Deviation of 2 Mean
How to find Linear Regression on TI-Nspire
How to find Quadratic Regression on TI-Nspire
How to find Matrix Operations on TI-Nspire
How to find Solving Equations on TI-Nspire
How to find Graphing Functions on TI-Nspire
How to find Integrals on TI-Nspire
How to find Derivatives on TI-Nspire
How to find Summation on TI-Nspire
How to find Factorial on TI-Nspire
How to find Combinations and Permutations on TI-Nspire
How to find Z-Score on TI-Nspire
How to find Probability Distributions on TI-Nspire
How to find ANOVA on TI-Nspire
How to find Histograms on TI-Nspire
How to find Box-and-Whisker Plots on TI-Nspire
How to find Present and Future Value on TI-Nspire
How to find Confidence Intervals on TI-Nspire
Population Standard Deviation and Sample Standard Deviation
Correlation Calculator
>
Covariance vs. Correlation
Dice Roller
Probability Distribution Calculator
Interquartile Range Calculator
Empirical Rule Calculator
Mean, Median and Mode Calculator
Average Calculator
Linear Regression Calculator
Sample Size Calculator
Other Statistical Tables
>
T Value Table
Chi-Square Table
F Distribution Table
Standard Deviation Calculator
Standard Deviation Problems
Normal vs Non-Normal Distribution: Understanding the Differences
Covariance vs. Variance: Understanding the Differences
Explanatory Variable: Understanding Its Role in Statistical Analysis
Independent variable vs dependent
What is a Residual in Statistics?
Left Skewed vs. Right Skewed Distributions
How to Find Variance on ti 84
Real Life Examples of Correlation
What is Regression Analysis?
Statistics Forum
Math
Combination Calculator
How to Calculate a Combination
Combination Formula in Statistics
Permutation Calculator
Distance Between Two Points Calculator
Exploring 7 Unsolvable Math Problems
>
Riemann Hypothesis
Math Problems
>
Math Problems for 1st Graders
Math Problems for 2nd Graders
Math Problems for 3rd Graders
Math Problems for 4th Graders
Math Problems for 5th Graders
Math Problems for 6th Graders
Math Problems for 7th Graders
Math Problems for 8th Graders
Math Problems for 9th Graders
Math Problems for 10th Graders
Math Problems for 11th Graders
Times Tables
>
1 Times Table
2 Times Table
3 Times Table
4 Times Table
5 Times Table
6 Times Table
7 Times Table
8 Times Table
9 Times Table
10 Times Table
Multiplication Tables
>
Multiplication Table by 20
Multiplication Table by 19
Multiplication Table by 18
Multiplication Table by 17
Multiplication Table by 16
Multiplication Table by 15
Multiplication Table by 14
Multiplication Table by 13
Multiplication Table by 12
Multiplication Table by 11
Multiplication Table by 10
Multiplication Table by 9
Multiplication Table by 8
Multiplication Table by 7
Multiplication Table by 6
Multiplication Table by 5
Multiplication Table by 4
Multiplication Table by 3
Roman Numerals Chart
Roman Numerals
>
Roman Numerals Converter
I Roman Numerals
II Roman Numerals
III Roman Numerals
IV Roman Numerals
V Roman Numerals
VI Roman Numerals
VII Roman Numerals
VIII Roman Numerals
IX Roman Numerals
X Roman Numerals
XI Roman Numerals
XII Roman Numerals
XIII Roman Numerals
XIV Roman Numerals
XV Roman Numerals
XVI Roman Numerals
XVII Roman Numerals
XVIII Roman Numerals
LXVI Roman Numerals
LXVII Roman Numerals
LXVIII Roman Numerals
LXIX Roman Numerals
LXX Roman Numerals
LXXI Roman Numerals
LXXII Roman Numerals
LXXIII Roman Numerals
LXXIV Roman Numerals
LXXV Roman Numerals
LXXVI Roman Numerals
LXXVII Roman Numerals
LXXVIII Roman Numerals
LXXIX Roman Numerals
LXXX Roman Numerals
LXXXI Roman Numerals
LXXXII Roman Numerals
LXXXIII Roman Numerals
LXXXIV Roman Numerals
LXXXV Roman Numerals
LXXXVI Roman Numerals
LXXXVII Roman Numerals
LXXXVIII Roman Numerals
LXXXIX Roman Numerals
XC Roman Numerals
XCI Roman Numerals
XCII Roman Numerals
XCIII Roman Numerals
XCIV Roman Numerals
XCV Roman Numerals
XCVI Roman Numerals
XCVII Roman Numerals
XCVIII Roman Numerals
XCIX Roman Numerals
C Roman Numerals
CI Roman Numerals
CII Roman Numerals
CIII Roman Numerals
CIV Roman Numerals
CV Roman Numerals
CVI Roman Numerals
CVII Roman Numerals
CVIII Roman Numerals
CIX Roman Numerals
CX Roman Numerals
CXI Roman Numerals
CXII Roman Numerals
CXIII Roman Numerals
CXIV Roman Numerals
CXV Roman Numerals
CXVI Roman Numerals
CXVII Roman Numerals
CXVIII Roman Numerals
CXIX Roman Numerals
CXX Roman Numerals
CXXI Roman Numerals
CXXII Roman Numerals
CXXIII Roman Numerals
CXXIV Roman Numerals
CXXV Roman Numerals
CXXVI Roman Numerals
CXXVII Roman Numerals
CXXVIII Roman Numerals
CXXIX Roman Numerals
CXXX Roman Numerals
CXXXI Roman Numerals
CXXXII Roman Numerals
CXXXIII Roman Numerals
CXXXIV Roman Numerals
CXXXV Roman Numerals
CXXXVI Roman Numerals
CXXXVII Roman Numerals
CXXXVIII Roman Numerals
CXXXIX Roman Numerals
CXL Roman Numerals
CXLI Roman Numerals
CXLII Roman Numerals
CXLIII Roman Numerals
CXLIV Roman Numerals
CXLV Roman Numerals
CXLVI Roman Numerals
CXLVII Roman Numerals
CXLVIII Roman Numerals
CXLIX Roman Numerals
CL Roman Numerals
CLI Roman Numerals
CLII Roman Numerals
CLIII Roman Numerals
CLIV Roman Numerals
CLV Roman Numerals
CLVI Roman Numerals
CLVII Roman Numerals
CLVIII Roman Numerals
CLIX Roman Numerals
CLX Roman Numerals
CLXI Roman Numerals
CLXII Roman Numerals
CLXIII Roman Numerals
CLXIV Roman Numerals
CLXV Roman Numerals
CLXVI Roman Numerals
CLXVII Roman Numerals
CLXVIII Roman Numerals
CLXIX Roman Numerals
CLXX Roman Numerals
CLXXI Roman Numerals
CLXXII Roman Numerals
CLXXIII Roman Numerals
CLXXIV Roman Numerals
CLXXV Roman Numerals
CLXXVI Roman Numerals
CLXXVII Roman Numerals
CLXXVIII Roman Numerals
CLXXIX Roman Numerals
CLXXX Roman Numerals
CLXXXI Roman Numerals
CLXXXII Roman Numerals
CLXXXIII Roman Numerals
CLXXXIV Roman Numerals
CLXXXV Roman Numerals
CLXXXVI Roman Numerals
CLXXXVII Roman Numerals
CLXXXVIII Roman Numerals
CLXXXIX Roman Numerals
CXC Roman Numerals
CXCI Roman Numerals
CXCII Roman Numerals
CXCIII Roman Numerals
CXCIV Roman Numerals
CXCV Roman Numerals
CXCVI Roman Numerals
CXCVII Roman Numerals
CXCVIII Roman Numerals
CXCIX in Roman Numerals
CC Roman Numerals
3 in Roman Numerals
4 in Roman Numerals
5 in Roman Numerals
6 in Roman Numerals
7 in Roman Numerals
8 in Roman Numerals
9 in Roman Numerals
10 in Roman Numerals
11 in Roman Numerals
12 in Roman Numerals
13 in Roman Numerals
14 in Roman Numerals
15 in Roman Numerals
16 in Roman Numerals
18 in Roman Numerals
19 in Roman Numerals
20 in Roman Numerals
22 in Roman Numerals
30 in Roman Numerals
50 in Roman Numerals
100 in Roman Numerals
500 in Roman Numerals
1000 in Roman Numerals
SAMPLE
>
TEMP XVII Roman Numerals
Percentage Increase Calculator
Linear Equations
>
Two-Variable Linear Equations Test with Answers
One Variable Linear Equations
>
Ax=B Linear Equation Calculator
Ax=B Linear Equation Practice Test
Decimal Places Value Chart
Cone Volume Calculator
Circumference Calculator
Rounding Calculator
>
Round 15 to the nearest ten
Round 75 to the nearest ten
Round 35 to the nearest ten
Round 5 to the nearest ten
Round 3 to the Nearest Ten
Factor Calculator
>
Factor of 36
Factor of 30
Factor of 32
Factor of 35
Factor of 39
Factor of 33
Factor of 34
Factor of 3
Factor of 3/4
Factor of 38
Radius of a Circle
Fraction Calculator
Perfect Square Calculator
>
Is 1 a perfect square
Is 2 a perfect square
Is 8 a perfect square
Is 9 a perfect square
Is 16 a perfect square
Is 20 a perfect square
Is 36 a perfect square
Is 49 a perfect square
Is 81 a perfect square
Is 125 a perfect square
Random Number Generator
>
Random and Pseudorandom Numbers
What is Random Number
Horizontal Line
X and Y Axis
Margin Calculator
Simple Interest Calculator
Sig Fig Calculator
Right Triangle Calculator
Money Counter
Root Calculator
Table of Square Roots
Square Root Calculator
>
Square root of 2
Square root of 8
Square root of 5
Square root of 4
Square root of 3
Square root of 64
Square root of 10
Square root of 16
Square root of 25
Square root of 12
Square root of 50
Square root of 20
Square root of 9
Square root of 100
Square root of 36
Square root of 6
Square root of 49
Square root of 1
Square root of 32
Square root of 40
Square root of 81
Square root of 18
Square root of 72
Square root of 13
Square root of 80
Square root of 45
Log Calculator
Inequality Symbols
Exponent calculator
Decimal to Fraction Calculator
Fraction to Percent Calculator
Scale Factor
Unit Conversion
Celsius to Fahrenheit Converter
>
-40 C to F
10 C to F
15 C to F
22 C to F
30 C to F
37 C to F
40 C to F
Fahrenheit to Celsius Converter
>
-40 F to C
17 Fahrenheit to Celsius
18 Fahrenheit to Celsius
19 Fahrenheit to Celsius
20 Fahrenheit to Celsius
23 Fahrenheit to Celsius
26 Fahrenheit to Celsius
27 Fahrenheit to Celsius
28 Fahrenheit to Celsius
37 Fahrenheit to Celsius
40 F to C
60 F to C
68 F to C
69 F to C
70 F to C
72 F to C
75 F to C
80 F to C
90 F to C
100 F to C
180 F to C
220 F to C
350 F to C
Weight conversion table kg to lbs
Kilograms to Pounds Converter
>
1 kg to lbs
2 kg to lbs
3 kg to lbs
4 kg to lbs
6 kg to lbs
8 kg to lbs
10 kg to lbs
12 kg to lbs
15 kg to lbs
16 kg to lbs
20 kg to lbs
23 kg to lbs
25 kg to lbs
30 kg to lbs
40 kg to lbs
45 kg to lbs
50 kg to lbs
53 kg to lbs
56 kg to lbs
57 kg to lbs
58 kg to lbs
59 kg to lbs
60 kg to lb
62 kg to lbs
63 kg to lbs
64 kg to lbs
65 kg to lbs
67 kg to lbs
68 kg to lbs
70 kg to lbs
72 kg to lbs
73 kg to lbs
74 kg to lbs
75 kg to lbs
76 kg to lbs
78 kg to lbs
80 kg to lbs
82 kg to lbs
84 kg to lbs
85 kg to lbs
90 kg to lbs
95 kg to lbs
150 kg to lbs
100 kg to lbs
Pounds to Kilograms Converter
>
1-10 LB to KG
>
1.25 lb to kg
2.25 lb to kg
3.75 lb to kg
1.75 lb to kg
1.56 lb to kg
5.25 lb to kg
2.75 lb to kg
1.87 lb to kg
1.65 lb to kg
2.87 lb to kg
0.75 lb to kg
0.75 lb to kg
1.1 lb to kg
1.21 lb to kg
1.32 lb to kg
3.25 lb to kg
1.55 lb to kg
2.65 lb to kg
1.37 lb to kg
0.55 lb to kg
1.85 lb to kg
2.15 lb to kg
1.14 lb to kg
3.31 lb to kg
0.88 lb to kg
1.15 lb to kg
5.29 lb to kg
0.45 lb to kg
4.75 lb to kg
0.85 lb to kg
0.95 lb to kg
5.11 lb to kg
0.44 lb to kg
1.82 lb to kg
2.85 lb to kg
0.68 lb to kg
1.13 lb to kg
0.05 lb to kg
2.47 lb to kg
3.85 lb to kg
4.23 lb to kg
1.38 lb to kg
2.91 lb to kg
4.12 lb to kg
2.95 lb to kg
5.73 lb to kg
2.99 lb to kg
1.78 lb to kg
3.35 lb to kg
1.92 lb to kg
1.58 lb to kg
5.51 lb to kg
1.28 lb to kg
0.02 lb to kg
1.42 lb to kg
0.89 lb to kg
1.16 lb to kg
1.99 lb to kg
1.69 lb to kg
2.17 lb to kg
1 lb to kg
1.6 lb to kg
2 lb to kg
3 lb to kg
4 lb to kg
5 lb to kg
6 lb to kg
7 lb to kg
8 lb to kg
9 lb to kg
10 lb to kg
11 lb to kg
12 lb to kg
12.5 lb to kg
13 lb to kg
14 lb to kg
15 lb to kg
16 lb to kg
17 lb to kg
18 lb to kg
19 lb to kg
20 lb to kg
21 lb to kg
22 lb to kg
23 lb to kg
24 lb to kg
25 lb to kg
26 lb to kg
27 lb to kg
28 lb to kg
29 lb to kg
30 lb to kg
31 lb to kg
32 lb to kg
33 lb to kg
35 lb to kg
40 lb to kg
45 lb to kg
50 lb to kg
55 lb to kg
60 lb to kg
70 lb to kg
90 lb to kg
98 lb to kg
99 lb to kg
100 lb to kg
130 lb to kg
150 lb to kg
Fluid Ounces to Milliliters
Kilometers to Miles Converter
>
1 kilometer to miles
5 km to miles
10 km to miles
15 km to miles
20 km to miles
50 km to miles
100 km to miles
Miles to Kilometers Conversion
>
1 mile to kilometers
5 miles to km
10 miles to km
15 miles to km
20 miles to km
KPH to MPH Converter
>
30 kph to mph
45 kph to mph
60 kph to mph
70 kph to mph
75 kph to mph
90 kph to mph
100 kph to mph
110 kph to mph
120 kph to mph
130 kph to mph
140 kph to mph
150 kph to mph
155 kph to mph
160 kph to mph
165 kph to mph
180 kph to mph
200 kph to mph
210 kph to mph
220 kph to mph
240 kph to mph
250 kph to mph
260 kph to mph
270 kph to mph
280 kph to mph
300 kph to mph
320 kph to mph
360 kph to mph
400 kph to mph
600 kph to mph
800 kph to mph
Inches to Millimeters Converter
>
1 inch to mm
1.5 inches to mm
2 inches to mm
2.5 inches to mm
3 inches to mm
4 inches to mm
5 inches to mm
6 inches to mm
18 inches to mm
34 inches to mm
160 inches to mm
Millimeters to Inches Converter
>
1 mm to inches
1.5 mm to inches
2 mm to inches
2.5 mm to inches
3 mm to inches
3.5 mm to inches
4 mm to inches
4.5 mm to inches
5 mm to inches
6 mm to inches
8 mm to inches
10 mm to inches
Meters to Feet Converter
>
1 Meter to Feet
2 Meters to Feet
3 Meters to Feet
5 Meters to Feet
10 Meters to Feet
20 Meters to Feet
30 Meters to Feet
50 Meters to Feet
100 Meters to Feet
Centimeters to Inches Converter
>
2 cm to inches
3 cm to inches
5 cm to inches
8 cm to inches
10 cm to inches
12 cm to inches
14 cm to inches
15 cm to inches
17 cm to inches
18 cm to inches
20 cm to inches
21 cm to inches
25 cm to inches
28 cm to inches
30 cm to inches
35 cm to inches
40 cm to inches
50 cm to inches
60 cm to inches
36 cm to inches
45 cm to inches
70 cm to inches
80 cm to inches
90 cm to inches
100 cm to inches
120 cm to inches
150 cm to inches
Centimeters to Feet Converter
>
150 cm to feet
160 cm to feet
162 cm to feet
163 cm to feet
164 cm to feet
165 cm to feet
170 cm to feet
172 cm to feet
173 cm to feet
175 cm to feet
178 cm to feet
180 cm to feet
182 cm to feet
183 cm to feet
185 cm to feet
190 cm to feet
Watts to Amps Calculator
>
500 Watts to Amps
800 Watts to Amps
1000 Watts to Amps
1200 Watts to Amps
1500 Watts to Amps
2500 Watts to Amps
3000 Watts to Amps
5000 Watts to Amps
MCG to MG Converter
>
5 mcg to mg
10 mcg to mg
50 mcg to mg
100 mcg to mg
125 mcg to mg
200 mcg to mg
250 mcg to mg
300 mcg to mg
400 mcg to mg
500 mcg to mg
1000 mcg to mg
Date & Time
Time Duration Calculator
Time Conversion Chart
Military Times Chart
Military Time Now Clock
Military Time Converter
GMT Time Clock
Time Zone
Age Calculator
Test Prep
CFA Exam Overview
>
How to Prepare for CFA level 1: An Actionable Study Guide
20 CFA Level 1 Practice Questions
CFA Practice Questions for level 1
30 CFA Level 1 Practice Questions
CFA Level 2 Practice Exam Questions
CFA Sample Practice Questions | Level 3| Answers and Explanations
CFA Exam Requirements
CFA Level 3 Salary
SAT Practice Test Math
Math Practice Test HiSET
Acing the SAT: A Comprehensive and Actionable Study Guide
GMAT Practice Questions Math with Answers and Explanations
GMAT Math Formulas Sheet
Math Practice Test for GED with Answers and Explanations
Math Problems to Solve | Practice Test
Free Practice TEAS Test
GRE Practice Math Questions | Free | Answers & Explanations
Formulas for GRE Math Section
ACT Practice Test with Answers and Explanations
CPA Practice Questions
ASVAB Practice Test
IQ Test
How many hours to study for CPA
How to Excel in Your CPA Exams: A Comprehensive Preparation Guide
Blog
Contact Us
Advertise Here
Privacy Policy
Useful Calculators and Converters
Español
XVIII Roman Numerals
XIX Roman Numerals
XX Roman Numerals
XXI Roman Numerals
XVIII Roman Numerals
XXII Roman Numerals
XXIII Roman Numerals
XXIV Roman Numerals
XXV Roman Numerals
XXVI Roman Numerals
XXVII Roman Numerals
XXVIII Roman Numerals
XXIX Roman Numerals
XXX Roman Numerals
XXXI Roman Numerals
XXXII Roman Numerals
XXXIII Roman Numerals
XXXIV Roman Numerals
XXXV Roman Numerals
XXXVI Roman Numerals
XXXVII Roman Numerals
XXXVIII Roman Numerals
XXXIX Roman Numerals
XL Roman Numerals
XLI Roman Numerals
XLII Roman Numerals
XLIII Roman Numerals
XLIV Roman Numerals
XLV Roman Numerals
XLVI Roman Numerals
XLVII Roman Numerals
XLVIII Roman Numerals
XLIX Roman Numerals
L Roman Numerals
LI Roman Numerals
LII Roman Numerals
LIII Roman Numerals
LIV Roman Numerals
LV Roman Numerals
LVI Roman Numerals
LVII Roman Numerals
LVIII Roman Numerals
LIX Roman Numerals
LX Roman Numerals
LXI Roman Numerals
LXII Roman Numerals
LXIII Roman Numerals
LXIV Roman Numerals
LXV Roman Numerals
XVIII Roman Numerals
TEMP XVII Roman Numerals
XVIII Roman Numerals
>
TEMP XVII Roman Numerals
Mole Calculator
BMI Calculator
Tic Tac Toe
100s Chart -Printable
Online Timer
Online Stopwatch
How Many Days Until Chritmas
Simple Interest Formula Explained
Understanding Simple Interest vs. Compound Interest
10 Real-World Simple Interest Examples
20 Simple Interest Problems
Compound Interest Practice Problems
34 lb to kg
36 lb to kg
37 lb to kg
38 lb to kg
39 lb to kg
41 lb to kg
42 lb to kg
43 lb to kg
44 lb to kg
46 lb to kg
47 lb to kg
48 lb to kg
49 lb to kg
51 lb to kg
52 lb to kg
53 lb to kg
54 lb to kg
56 lb to kg
57 lb to kg
58 lb to kg
59 lb to kg
61 lb to kg
62 lb to kg
63 lb to kg
64 lb to kg
65 lb to kg