Z Score Probability Calculator for Left and Right Tail Probability
Use our easy-to-use z score probability calculator to calculate left-tail, right-tail, and two-tail probabilities quickly and accurately. If you need to calculate a z score visit our z score calculator page. If you need to lookup z values in a table go to z-table.com.
Z-Score Probability Calculator
Result
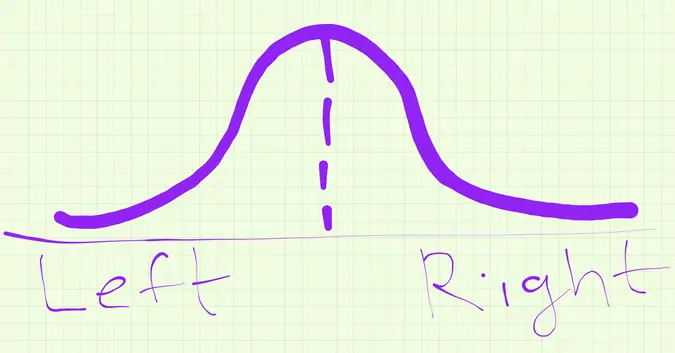
Left tail probability:
Right tail probability:
Z Score Probabilities Explained
Z-scores are an important part of statistics, as they help us calculate probabilities and make informed decisions based on data analysis. In this blog post, we will explore z-scores and their importance in statistics, along with a brief explanation of how z-scores are used to calculate probabilities.
What are the different types of probabilities in z-scores?
Left-tail probabilities
Left-tail probabilities are the probabilities that a z-score will fall to the left of a certain point on a standard normal distribution curve. In simpler terms, this means that we are interested in finding the probability of getting a value less than a certain z-score. For example, if we want to know the probability of getting a z-score of -1.5 or less, we are calculating a left-tail probability.
To calculate left-tail probabilities, we use the standard normal distribution table, which provides us with the probabilities associated with different z-scores. Let's explore an example to better understand this. Say we want to find the probability of getting a z-score of -1.5 or less. We look up -1.5 in the standard normal distribution table, and we find the probability to be 0.0668.
Right-tail probabilities
Right-tail probabilities are the probabilities that a z-score will fall to the right of a certain point on a standard normal distribution curve. In other words, we are interested in finding the probability of getting a value greater than a certain z-score. For example, if we want to know the probability of getting a z-score of 1.5 or greater, we are calculating a right-tail probability.
To calculate right-tail probabilities, we use the same standard normal distribution table. Here is an example. Say we want to find the probability of getting a z-score of 1.5 or greater. We look up 1.5 in the standard normal distribution table, and we find the probability to be 0.0668.
Two-tail probabilities
Two-tail probabilities are the probabilities that a z-score will fall within a certain range on a standard normal distribution curve. This means that we are interested in finding the probability of getting a value between two z-scores. For example, if we want to know the probability of getting a z-score between -1.5 and 1.5, we are calculating a two-tail probability.
To calculate two-tail probabilities, we use the standard normal distribution table as well. However, we need to make a few adjustments to our calculations. Say we want to find the probability of getting a z-score between -1.5 and 1.5. We look up -1.5 and 1.5 in the standard normal distribution table and find their respective probabilities to be 0.0668. We then subtract the left-tail probability from the right-tail probability to get the two-tail probability, which is 0.9332.
How to calculate probability using z-scores?
Now that we understand the different types of probabilities in z-scores, let's explore how we can calculate these probabilities using z-scores.
Explanation of the standard normal distribution table
The standard normal distribution table is a table that provides us with the probabilities associated with different z-scores. The table is divided into two parts - the positive z-scores and the negative z-scores. The positive z-scores represent the right side of the standard normal distribution curve, while the negative z-scores represent the left side of the curve.
The table gives us the area under the standard normal distribution curve to the left of a given z-score. The table is used to find the probability of getting a z-score less than, greater than, or between certain values.
Example of how to use the standard normal distribution table to calculate probabilities
Let's take an example to understand how to use the standard normal distribution table to calculate probabilities. Say we want to find the probability of getting a z-score less than -1.25. We look up -1.25 in the negative z-score column of the standard normal distribution table and find its associated probability to be 0.1056. This means that the probability of getting a z-score less than -1.25 is 0.1056.
Similarly, if we want to find the probability of getting a z-score greater than 1.75, we look up 1.75 in the positive z-score column of the standard normal distribution table and find its associated probability to be 0.0401. This means that the probability of getting a z-score greater than 1.75 is 0.0401.
How to interpret the results of probability calculations using z-scores?
Once we have calculated the probabilities using z-scores, it is important to interpret the results correctly to make informed decisions based on data analysis.
Explanation of how to interpret probability calculations
The probabilities we calculate using z-scores represent the likelihood of getting a certain value or range of values in a dataset. For example, if we calculate a probability of 0.05 for a certain z-score, this means that there is a 5% chance of getting a value less than or equal to that z-score.
Examples of probability interpretations
Let's take an example to understand how to interpret probability calculations. Say we have calculated a left-tail probability of 0.025 for a certain z-score. This means that there is a 2.5% chance of getting a value less than or equal to that z-score. Similarly, if we have calculated a two-tail probability of 0.10 for a certain range of z-scores, this means that there is a 10% chance of getting a value within that range.
In conclusion, z-scores are an important part of statistics that help us calculate probabilities and make informed decisions based on data analysis. We have explored the different types of probabilities in z-scores - left-tail, right-tail, and two-tail probabilities - along with a brief explanation of how to calculate these probabilities using the standard normal distribution table. We have also discussed the importance of interpreting the results of probability calculations correctly to make informed decisions. It is important to understand z-scores and their applications in statistics to be able to analyze data effectively and make informed decisions.