Z SCORE TABLE
  • Z Table
    • Z Scores to Percentiles Chart
    • Z Score Calculator
    • Z Score Probability Calculator
    • Interactive Z Table
    • Z Score Formula
    • How to calculate the z score
    • How To Use Z-Score Table
    • Calculate Z-score
    • Parameters in Statistics
    • Z Score Chart Basics
    • History on Normal Distirbution
    • Statistics Z Score Jokes
    • When to Use Z Test vs T Test
    • Z Score Practice Problems
    • Confidence Interval Calculator >
      • Confidence Interval in Excel
      • 90 confidence interval z score
      • 95 Confidence Interval Z Score
      • 99 Confidence Interval Z Score
    • Z Score Confidence Interval
  • Statistics
    • Statistics Symbols
    • Statistics Formulas >
      • Binomial Coefficient
      • Empirical Rule
      • Correlation Coefficient
    • Cumulative Binomial Probability Calculator
    • Interquartile Range Calculator
    • Empirical Rule Calculator
    • Mean, Median and Mode Calculator
    • Sample Size Calculator
    • Other Statistical Tables >
      • T Value Table
      • Chi-Square Table
      • F Distribution Table
    • Standard Deviation Calculator
    • Normal vs Non-Normal Distribution: Understanding the Differences
    • Explanatory Variable: Understanding Its Role in Statistical Analysis
    • Independent variable vs dependent
    • Statistics Forum
  • Math
    • Times Tables >
      • 1 Times Table
      • 2 Times Table
      • 3 Times Table
      • 4 Times Table
      • 5 Times Table
      • 6 Times Table
      • 7 Times Table
      • 8 Times Table
      • 9 Times Table
      • 10 Times Table
    • Multiplication Tables >
      • Multiplication Table by 20
      • Multiplication Table by 19
      • Multiplication Table by 18
      • Multiplication Table by 17
      • Multiplication Table by 16
      • Multiplication Table by 15
      • Multiplication Table by 14
      • Multiplication Table by 13
      • Multiplication Table by 12
      • Multiplication Table by 11
      • Multiplication Table by 10
      • Multiplication Table by 9
      • Multiplication Table by 8
      • Multiplication Table by 7
      • Multiplication Table by 6
      • Multiplication Table by 5
      • Multiplication Table by 4
      • Multiplication Table by 3
    • Roman Numerals >
      • Roman Numerals Chart
      • Roman Numerals Converter
      • I Roman Numerals
      • II Roman Numerals
      • III Roman Numerals
      • IV Roman Numerals
      • V Roman Numerals
      • VI Roman Numerals
      • VII Roman Numerals
      • VIII Roman Numerals
      • IX Roman Numerals
      • X Roman Numerals
      • XI Roman Numerals
      • XII Roman Numerals
      • XIII Roman Numerals
      • XIV Roman Numerals
      • XV Roman Numerals
      • XVI Roman Numerals
      • XVII Roman Numerals
      • XLVI Roman Numerals >
        • TEMP XVII Roman Numerals
    • Percentage Increase Calculator
    • Linear Equations >
      • Two-Variable Linear Equations Test with Answers
      • One Variable Linear Equations >
        • Ax=B Linear Equation Calculator
        • Ax=B Linear Equation Practice Test
    • Decimal Places Value Chart
    • Cone Volume Calculator
    • Rounding Calculator >
      • Round 15 to the nearest ten
      • Round 75 to the nearest ten
      • Round 35 to the nearest ten
      • Round 5 to the nearest ten
      • Round 3 to the Nearest Ten
    • Factor Calculator >
      • Factor of 36
      • Factor of 30
      • Factor of 32
      • Factor of 35
      • Factor of 39
      • Factor of 33
      • Factor of 34
      • Factor of 3
      • Factor of 3/4
      • Factor of 38
    • Radius of a Circle
    • Fraction Calculator
    • Random Number Generator
    • Horizontal Line
    • X and Y Axis
    • Root Calculator
    • Square Root Calculator >
      • Square root of 2
      • Square root of 8
      • Square root of 5
      • Square root of 4
      • Square root of 3
      • Square root of 64
      • Square root of 10
      • Square root of 16
      • Square root of 25
      • Square root of 12
      • Square root of 50
      • Square root of 20
      • Square root of 9
      • Square root of 100
      • Square root of 36
      • Square root of 6
      • Square root of 49
      • Square root of 1
      • Square root of 32
      • Square root of 40
      • Square root of 81
      • Square root of 18
      • Square root of 72
      • Square root of 13
      • Square root of 80
      • Square root of 45
    • Log Calculator
    • Inequality Symbols
    • Exponent calculator
    • Decimal to Fraction Calculator
    • Fraction to Percent Calculator
    • Scale Factor
  • Unit Conversion
    • Celsius to Fahrenheit Converter >
      • 37 C to F
    • Fahrenheit to Celsius Converter >
      • 68 F to C
    • Kilograms to Pounds Converter >
      • 60 kg to lb
      • 80 kg to lbs
      • 150 kg to lbs
      • 100 kg to lbs
      • 50 kg to lbs
    • Pounds to Kilograms Converter >
      • 1 lb to kg
      • 10 lb to kg
      • 40 lb to kg
      • 50 lb to kg
      • 60 lb to kg
      • 90 lb to kg
      • 100 lb to kg
      • 130 lb to kg
      • 150 lb to kg
    • Fluid Ounces to Milliliters
    • Kilometers to Miles Converter >
      • 1 kilometer to miles
      • 5 km to miles
      • 10 km to miles
      • 15 km to miles
      • 20 km to miles
      • 50 km to miles
      • 100 km to miles
    • Miles to Kilometers Conversion >
      • 1 mile to kilometers
      • 5 miles to km
      • 10 miles to km
      • 15 miles to km
      • 20 miles to km
    • KPH to MPH Converter >
      • 300 kph to mph
    • Millimeters to Inches Converter
    • Meters to Feet Converter >
      • 1 Meter to Feet
      • 2 Meters to Feet
      • 3 Meters to Feet
      • 5 Meters to Feet
      • 10 Meters to Feet
      • 20 Meters to Feet
      • 30 Meters to Feet
      • 50 Meters to Feet
      • 100 Meters to Feet
    • Centimeters to Inches Converter >
      • 2 cm to inches
      • 3 cm to inches
      • 5 cm to inches
      • 8 cm to inches
      • 10 cm to inches
      • 12 cm to inches
      • 14 cm to inches
      • 15 cm to inches
      • 17 cm to inches
      • 18 cm to inches
      • 20 cm to inches
      • 21 cm to inches
      • 25 cm to inches
      • 28 cm to inches
      • 30 cm to inches
      • 35 cm to inches
      • 40 cm to inches
      • 50 cm to inches
      • 60 cm to inches
      • 36 cm to inches
      • 45 cm to inches
      • 70 cm to inches
      • 80 cm to inches
      • 90 cm to inches
      • 100 cm to inches
      • 120 cm to inches
      • 150 cm to inches
  • Date & Time
    • Time Conversion Chart
    • Military Times Chart
    • Time Zone
  • Test Prep
    • SAT Practice Test Math
    • Acing the SAT: A Comprehensive and Actionable Study Guide
    • GMAT Practice Questions Math with Answers and Explanations
    • GMAT Math Formulas Sheet
    • Math Practice Test for GED with Answers and Explanations
    • CFA Sample Practice Questions | Level 3| Answers and Explanations
    • How to Prepare for CFA level 1: An Actionable Study Guide
    • ​GRE Practice Math Questions | Free | Answers & Explanations
    • Formulas for GRE Math Section
    • ACT Practice Test with Answers and Explanations
    • CFA Practice Questions for level 1
    • CPA Practice Questions
    • How many hours to study for CPA
    • How to Excel in Your CPA Exams: A Comprehensive Preparation Guide
  • Blog
  • Contact Us
    • Advertise Here
    • Privacy Policy
    • Useful Calculators and Converters
  • Español
    • XVIII Roman Numerals
    • XIX Roman Numerals
    • XX Roman Numerals
    • XXI Roman Numerals
    • XXII Roman Numerals
    • XXIII Roman Numerals
    • XXIV Roman Numerals
    • XXV Roman Numerals
  • TEMPVIII Roman Numerals
  • XVIII Roman Numerals

​​Understanding the Correlation Coefficient: A Comprehensive Guide

Statistical analysis is an essential component of many fields, from finance to psychology to sociology, among others. One of the most common techniques used in statistics is measuring the relationship between two variables - a process facilitated by the correlation coefficient. This comprehensive guide will explain the concept of the correlation coefficient, provide examples, and detail how to interpret its value.

​What is the Correlation Coefficient?

The correlation coefficient is a statistical measure that calculates the strength of the relationship between the relative movements of two variables. The values range between -1.0 and 1.0. A calculated number greater than 1.0 or less than -1.0 means that there was an error in the correlation measurement.
​

A correlation of -1.0 shows a perfect negative correlation, while a correlation of 1.0 shows a perfect positive correlation. A correlation of 0.0 shows no linear relationship between the movement of the two variables.

​Types of Correlation Coefficients

There are several types of correlation coefficients, but the most commonly used are Pearson's correlation coefficient (r) and Spearman's rank correlation coefficient.

Pearson's Correlation Coefficient
Pearson's correlation coefficient, also known as Pearson's r, is a statistical measure that quantifies the strength and direction of a linear relationship between two variables. It's most appropriate to use when both variables are normally distributed and have a linear relationship.

The formula for Pearson's r is:

r = Σ[(xi - x̄)(yi - ȳ)] / √[Σ(xi - x̄)² * Σ(yi - ȳ)²]
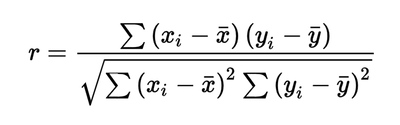
pearson's correlation coefficient formula

Where:
• xi and yi are the individual sample points indexed with i
• x̄ is the mean (average) of the x values
• ȳ is the mean of the y values
• Σ denotes the sum of the values indicated

Spearman's Rank Correlation Coefficient
Spearman's rank correlation coefficient, or Spearman's rho, is a non-parametric measure of the strength and direction of association that exists between two ranked variables. It's most appropriate when one or both variables are ordinal or when they're not normally distributed.

The formula for Spearman's rho is:


ρ = 1 - [(6 * Σdi²) / (n * (n² - 1))]
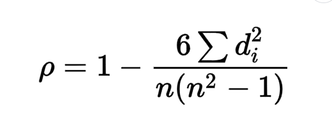
Spearman's Rank Correlation Coefficient formula


Where:
• di is the difference between the ranks of corresponding variables
• n is the number of observations
• Σ denotes the sum of the values indicated

​Correlation Coefficient Examples

Let's illustrate the concept of the correlation coefficient with two examples.

Example 1: Pearson's Correlation Coefficient
Consider a researcher investigating a potential correlation between time spent studying for an exam and the score achieved on the exam.
​

Here's the data for 5 students:
correlation coefficient example 1 dataset
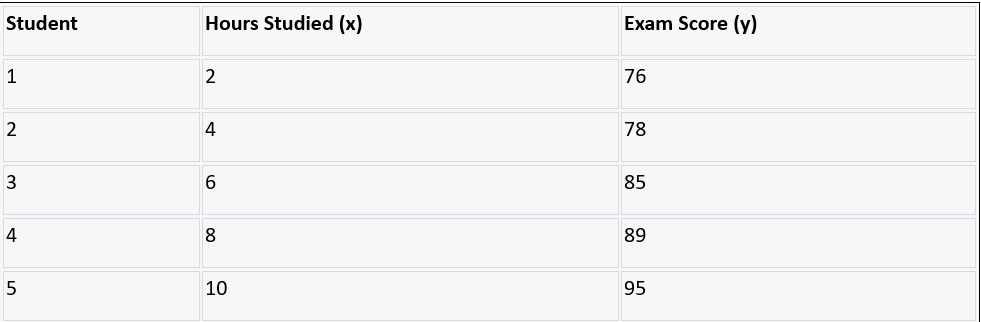
The first step is to find the sums and squares of the x and y values and the sum of the products of x and y:

Σx = 2 + 4 + 6 + 8 + 10 = 30
Σy = 76 + 78 + 85 + 89 + 95 = 423
Σx² = 2² + 4² + 6² + 8² + 10² = 220
Σy² = 76² + 78² + 85² + 89² + 95² = 36161
Σxy = 276 + 478 + 685 + 889 + 10*95 = 2470


Now plug these values into the formula for Pearson's r:

r = [5 * Σxy - Σx * Σy] / sqrt{ [5 * Σx² - (Σx)²] * [5 * Σy² - (Σy)²] }
r = [5 * 2470 - 30 * 423] / sqrt{ [5 * 220 - 30²] * [5 * 36161 - 423²] }
r = 0.989 // Approximate value, indicating a strong positive correlation


This strong positive correlation suggests that more hours spent studying is associated with higher exam scores.​

Example 2: Spearman's Rank Correlation Coefficient
​

Consider a clinical researcher investigating a potential correlation between the rank of a patient's pain severity (on a scale of 1 to 5) and the rank of the improvement reported after a new treatment.
​

Here's the data for 5 patients:
correlation coefficient example 2
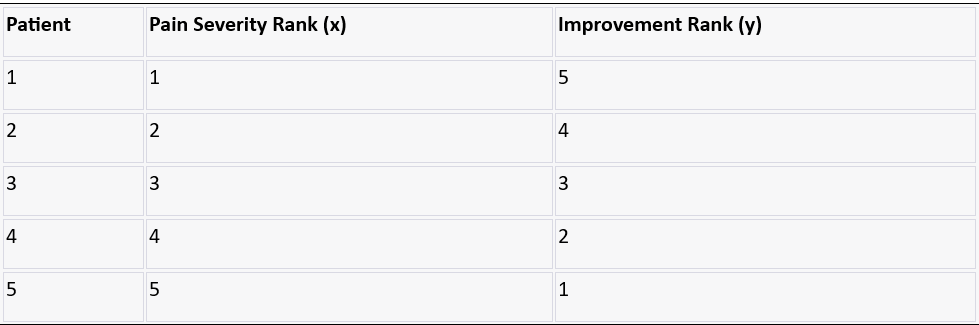
The first step is to find the differences between the ranks (d) and then square these differences (d²):
d = x - y
d² = d²
example 2 correlation coefficient table
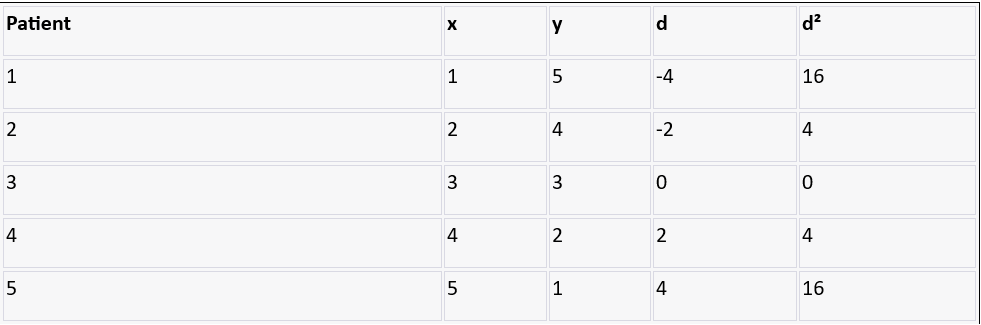
Now, plug these values into the Spearman's rank correlation coefficient formula:

ρ = 1 - [ (6 * Σd²) / (n³ - n) ]
ρ = 1 - [ (6 * 40) / (5³ - 5) ]
ρ = -1

A correlation coefficient of -1 implies a perfect negative correlation, suggesting that patients with more severe pain reported greater improvement after the treatment.

​Interpreting the Correlation Coefficient

Interpreting the correlation coefficient involves understanding its magnitude (strength) and direction.

Strength
The closer the correlation coefficient is to 1 or -1, the stronger the correlation. A coefficient of 0.8, for example, indicates a strong positive relationship, while a coefficient of -0.8 indicates a strong negative relationship. Conversely, a coefficient close to 0 indicates no linear relationship.
​

Direction
The sign of the correlation coefficient indicates the direction of the relationship. A positive coefficient indicates a positive correlation — as one variable increases, the other also increases. A negative coefficient, on the other hand, denotes a negative correlation — as one variable increases, the other decreases.

​Use Cases of Correlation Coefficients

Correlation coefficients are used in a variety of fields to measure how certain variables are interdependent.
  • In finance, it can be used to compare the performance of a stock or investment portfolio with the market or other stocks and portfolios.
  • In psychology, it can measure the relationship between variables like stress and health conditions.
  • In medicine, it can analyze the correlation between different treatments and patient outcomes.
  • In sociology, it can evaluate the link between social factors like education level and income.

​Correlation Coefficients and the z-score

In statistics, the z-score is another crucial concept that plays a vital role in understanding the correlation coefficient. It's a measure of how many standard deviations a data point is from the mean. The z-score can be calculated for each value in a dataset, and then a correlation coefficient can be calculated for the z-scores.

If a dataset is transformed into z-scores and the correlation coefficient is calculated for the transformed dataset, the result will be the same as if the correlation coefficient was calculated for the original dataset. This property is useful in many statistical tests that assume normally distributed data, as transforming to z-scores can help meet this assumption.

The correlation coefficient is an essential concept in statistics, which allows us to understand and quantify the relationship between two variables. Through the examples and detailed explanations provided in this guide, you should now have a more in-depth understanding of the correlation coefficient and how to interpret it effectively.

Proudly powered by Weebly
  • Z Table
    • Z Scores to Percentiles Chart
    • Z Score Calculator
    • Z Score Probability Calculator
    • Interactive Z Table
    • Z Score Formula
    • How to calculate the z score
    • How To Use Z-Score Table
    • Calculate Z-score
    • Parameters in Statistics
    • Z Score Chart Basics
    • History on Normal Distirbution
    • Statistics Z Score Jokes
    • When to Use Z Test vs T Test
    • Z Score Practice Problems
    • Confidence Interval Calculator >
      • Confidence Interval in Excel
      • 90 confidence interval z score
      • 95 Confidence Interval Z Score
      • 99 Confidence Interval Z Score
    • Z Score Confidence Interval
  • Statistics
    • Statistics Symbols
    • Statistics Formulas >
      • Binomial Coefficient
      • Empirical Rule
      • Correlation Coefficient
    • Cumulative Binomial Probability Calculator
    • Interquartile Range Calculator
    • Empirical Rule Calculator
    • Mean, Median and Mode Calculator
    • Sample Size Calculator
    • Other Statistical Tables >
      • T Value Table
      • Chi-Square Table
      • F Distribution Table
    • Standard Deviation Calculator
    • Normal vs Non-Normal Distribution: Understanding the Differences
    • Explanatory Variable: Understanding Its Role in Statistical Analysis
    • Independent variable vs dependent
    • Statistics Forum
  • Math
    • Times Tables >
      • 1 Times Table
      • 2 Times Table
      • 3 Times Table
      • 4 Times Table
      • 5 Times Table
      • 6 Times Table
      • 7 Times Table
      • 8 Times Table
      • 9 Times Table
      • 10 Times Table
    • Multiplication Tables >
      • Multiplication Table by 20
      • Multiplication Table by 19
      • Multiplication Table by 18
      • Multiplication Table by 17
      • Multiplication Table by 16
      • Multiplication Table by 15
      • Multiplication Table by 14
      • Multiplication Table by 13
      • Multiplication Table by 12
      • Multiplication Table by 11
      • Multiplication Table by 10
      • Multiplication Table by 9
      • Multiplication Table by 8
      • Multiplication Table by 7
      • Multiplication Table by 6
      • Multiplication Table by 5
      • Multiplication Table by 4
      • Multiplication Table by 3
    • Roman Numerals >
      • Roman Numerals Chart
      • Roman Numerals Converter
      • I Roman Numerals
      • II Roman Numerals
      • III Roman Numerals
      • IV Roman Numerals
      • V Roman Numerals
      • VI Roman Numerals
      • VII Roman Numerals
      • VIII Roman Numerals
      • IX Roman Numerals
      • X Roman Numerals
      • XI Roman Numerals
      • XII Roman Numerals
      • XIII Roman Numerals
      • XIV Roman Numerals
      • XV Roman Numerals
      • XVI Roman Numerals
      • XVII Roman Numerals
      • XLVI Roman Numerals >
        • TEMP XVII Roman Numerals
    • Percentage Increase Calculator
    • Linear Equations >
      • Two-Variable Linear Equations Test with Answers
      • One Variable Linear Equations >
        • Ax=B Linear Equation Calculator
        • Ax=B Linear Equation Practice Test
    • Decimal Places Value Chart
    • Cone Volume Calculator
    • Rounding Calculator >
      • Round 15 to the nearest ten
      • Round 75 to the nearest ten
      • Round 35 to the nearest ten
      • Round 5 to the nearest ten
      • Round 3 to the Nearest Ten
    • Factor Calculator >
      • Factor of 36
      • Factor of 30
      • Factor of 32
      • Factor of 35
      • Factor of 39
      • Factor of 33
      • Factor of 34
      • Factor of 3
      • Factor of 3/4
      • Factor of 38
    • Radius of a Circle
    • Fraction Calculator
    • Random Number Generator
    • Horizontal Line
    • X and Y Axis
    • Root Calculator
    • Square Root Calculator >
      • Square root of 2
      • Square root of 8
      • Square root of 5
      • Square root of 4
      • Square root of 3
      • Square root of 64
      • Square root of 10
      • Square root of 16
      • Square root of 25
      • Square root of 12
      • Square root of 50
      • Square root of 20
      • Square root of 9
      • Square root of 100
      • Square root of 36
      • Square root of 6
      • Square root of 49
      • Square root of 1
      • Square root of 32
      • Square root of 40
      • Square root of 81
      • Square root of 18
      • Square root of 72
      • Square root of 13
      • Square root of 80
      • Square root of 45
    • Log Calculator
    • Inequality Symbols
    • Exponent calculator
    • Decimal to Fraction Calculator
    • Fraction to Percent Calculator
    • Scale Factor
  • Unit Conversion
    • Celsius to Fahrenheit Converter >
      • 37 C to F
    • Fahrenheit to Celsius Converter >
      • 68 F to C
    • Kilograms to Pounds Converter >
      • 60 kg to lb
      • 80 kg to lbs
      • 150 kg to lbs
      • 100 kg to lbs
      • 50 kg to lbs
    • Pounds to Kilograms Converter >
      • 1 lb to kg
      • 10 lb to kg
      • 40 lb to kg
      • 50 lb to kg
      • 60 lb to kg
      • 90 lb to kg
      • 100 lb to kg
      • 130 lb to kg
      • 150 lb to kg
    • Fluid Ounces to Milliliters
    • Kilometers to Miles Converter >
      • 1 kilometer to miles
      • 5 km to miles
      • 10 km to miles
      • 15 km to miles
      • 20 km to miles
      • 50 km to miles
      • 100 km to miles
    • Miles to Kilometers Conversion >
      • 1 mile to kilometers
      • 5 miles to km
      • 10 miles to km
      • 15 miles to km
      • 20 miles to km
    • KPH to MPH Converter >
      • 300 kph to mph
    • Millimeters to Inches Converter
    • Meters to Feet Converter >
      • 1 Meter to Feet
      • 2 Meters to Feet
      • 3 Meters to Feet
      • 5 Meters to Feet
      • 10 Meters to Feet
      • 20 Meters to Feet
      • 30 Meters to Feet
      • 50 Meters to Feet
      • 100 Meters to Feet
    • Centimeters to Inches Converter >
      • 2 cm to inches
      • 3 cm to inches
      • 5 cm to inches
      • 8 cm to inches
      • 10 cm to inches
      • 12 cm to inches
      • 14 cm to inches
      • 15 cm to inches
      • 17 cm to inches
      • 18 cm to inches
      • 20 cm to inches
      • 21 cm to inches
      • 25 cm to inches
      • 28 cm to inches
      • 30 cm to inches
      • 35 cm to inches
      • 40 cm to inches
      • 50 cm to inches
      • 60 cm to inches
      • 36 cm to inches
      • 45 cm to inches
      • 70 cm to inches
      • 80 cm to inches
      • 90 cm to inches
      • 100 cm to inches
      • 120 cm to inches
      • 150 cm to inches
  • Date & Time
    • Time Conversion Chart
    • Military Times Chart
    • Time Zone
  • Test Prep
    • SAT Practice Test Math
    • Acing the SAT: A Comprehensive and Actionable Study Guide
    • GMAT Practice Questions Math with Answers and Explanations
    • GMAT Math Formulas Sheet
    • Math Practice Test for GED with Answers and Explanations
    • CFA Sample Practice Questions | Level 3| Answers and Explanations
    • How to Prepare for CFA level 1: An Actionable Study Guide
    • ​GRE Practice Math Questions | Free | Answers & Explanations
    • Formulas for GRE Math Section
    • ACT Practice Test with Answers and Explanations
    • CFA Practice Questions for level 1
    • CPA Practice Questions
    • How many hours to study for CPA
    • How to Excel in Your CPA Exams: A Comprehensive Preparation Guide
  • Blog
  • Contact Us
    • Advertise Here
    • Privacy Policy
    • Useful Calculators and Converters
  • Español
    • XVIII Roman Numerals
    • XIX Roman Numerals
    • XX Roman Numerals
    • XXI Roman Numerals
    • XXII Roman Numerals
    • XXIII Roman Numerals
    • XXIV Roman Numerals
    • XXV Roman Numerals
  • TEMPVIII Roman Numerals
  • XVIII Roman Numerals
x
x