Standard Deviation Calculator
Use our online Standard Deviation Calculator to quickly and easily calculate the standard deviation, variance, mean, count, and sum of any data set
Standard Deviation Calculator
To use this standard deviation calculator, simply enter a series of numbers separated by commas in the input field. Then select whether the numbers represent a population or a sample, and click the "Calculate" button. The calculator will return the count, sum, mean, variance, and standard deviation of the input numbers.
Understanding Standard Deviation: A Comprehensive Guide
Standard deviation is a commonly used measure of the variability or spread of a data set. It tells us how much the data points in a set deviate from the mean or average value. In this comprehensive guide, we will explore everything you need to know about standard deviation, including its formula, sample vs population standard deviation, and how to calculate and interpret it.
What is Standard Deviation?
Standard deviation is a statistical measure that tells us how much the data points in a set deviate from the mean or average value. In other words, it measures the degree of variation or dispersion of a set of data points. When the standard deviation is low, it suggests that the data points are tightly clustered around the mean value, whereas a high standard deviation implies that the data points are more dispersed, covering a wider range of values.
The Formula for Standard Deviation
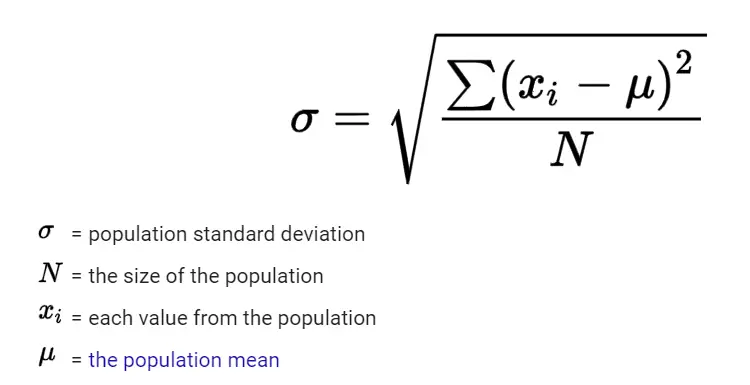
The formula calculating the standard deviation is:
Standard Deviation = √(Σ(x - µ)²/N)
Where:
Standard Deviation = √(Σ(x - µ)²/N)
Where:
- Σ is the sum of all the values in the dataset
- x is the value of each individual data point
- µ refers to the average or mean value of the dataset
- N represents the total number of data points present in the dataset.
Sample vs Population Standard Deviation
Two types of standard deviation exist: sample standard deviation and population standard deviation. The key difference between them is the dataset that they are calculated from.
Sample standard deviation is used when the data set is a sample or a subset of the population. Here, we need use this formula:
Sample Standard Deviation = √(Σ(x - x̄)²/(n-1))
Where:
Sample standard deviation is used when the data set is a sample or a subset of the population. Here, we need use this formula:
Sample Standard Deviation = √(Σ(x - x̄)²/(n-1))
Where:
- Σ is the sum of all the values in the sample
- x is the value of each individual data point in the sample
- x̄ is the mean of the sample
- n is the sample size
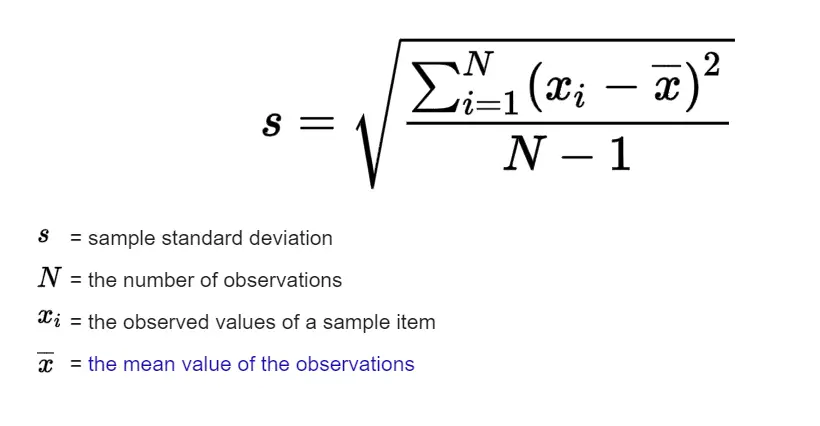
Note that when calculating sample standard deviation, we divide the sum of squared differences by (n-1) instead of n, which is called Bessel's correction. This is because a sample is only a subset of the entire population, and using (n-1) instead of n gives a more accurate estimate of the true population standard deviation.
Calculating Standard Deviation: An Example
Let's say we have a dataset of 10 numbers: 2, 4, 5, 6, 7, 8, 10, 11, 12, 14. To find the standard deviation, we first need to calculate the mean of the dataset:
Mean = (2+4+5+6+7+8+10+11+12+14)/10 = 7.9
Next, we calculate the sum of squared differences:
(2-7.9)² + (4-7.9)² + (5-7.9)² + (6 -7.9)² + (7-7.9)² + (8-7.9)² + (10-7.9)² + (11-7.9)² + (12-7.9)² + (14-7.9)² = 104.2
Then, we divide the sum of squared differences by the total number of data points and take the square root of the result:
Standard Deviation = √(104.2/10) = 3.23
So, the standard deviation of our dataset is 3.23.
Interpreting Standard Deviation
Once we have calculated the standard deviation of a dataset, we can use it to interpret the variability or spread of the data. A small standard deviation indicates that the data points are tightly clustered around the mean, while a large standard deviation indicates that the data points are more spread out.
For example, let's say we have two datasets: Dataset A and Dataset B. The mean of both datasets is 50, but the standard deviation of Dataset A is 2 and the standard deviation of Dataset B is 10. This means that Dataset A has less variability than Dataset B, and its data points are more tightly clustered around the mean.
Applications of Standard Deviation
Standard deviation has a wide range of applications in various fields. Here are a few examples:
Standard deviation is an important statistical measure that tells us how much the data points in a set deviate from the mean or average value. It is calculated using a specific formula and can be used to interpret the variability or spread of a dataset. By understanding the differences between sample and population standard deviation and how to calculate and interpret standard deviation, we can use this measure to gain valuable insights into various fields, from finance to education and beyond. For more statistics and math related tools and resources visit us at z-table.com.
For example, let's say we have two datasets: Dataset A and Dataset B. The mean of both datasets is 50, but the standard deviation of Dataset A is 2 and the standard deviation of Dataset B is 10. This means that Dataset A has less variability than Dataset B, and its data points are more tightly clustered around the mean.
Applications of Standard Deviation
Standard deviation has a wide range of applications in various fields. Here are a few examples:
- Finance: In finance, standard deviation is used to measure the volatility of stocks and other financial instruments. A higher standard deviation indicates that the stock or instrument is more volatile and carries a higher risk.
- Quality Control: In manufacturing, standard deviation is used to measure the variability of a product's quality. A low standard deviation indicates that the product is consistent and meets the required quality standards.
- Education: In education, standard deviation is used to measure the performance of students. A high standard deviation indicates that there is a wide range of performance levels among students, while a low standard deviation indicates that most students are performing at similar levels.
Standard deviation is an important statistical measure that tells us how much the data points in a set deviate from the mean or average value. It is calculated using a specific formula and can be used to interpret the variability or spread of a dataset. By understanding the differences between sample and population standard deviation and how to calculate and interpret standard deviation, we can use this measure to gain valuable insights into various fields, from finance to education and beyond. For more statistics and math related tools and resources visit us at z-table.com.