Z Table
Use this z table, also referred as z score table, standard normal distribution table and z value chart, to find a z score. If you are not sure how to look up z score probabilities in the z tables, you will find easy to use z score probability calculator (to find right and left tail probabilities) and a z score calculator (to calculate a z score) right after the tables. You can also scroll down for both calculators on this page.
|
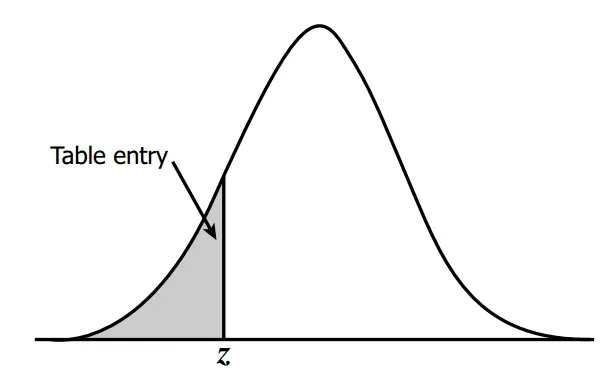
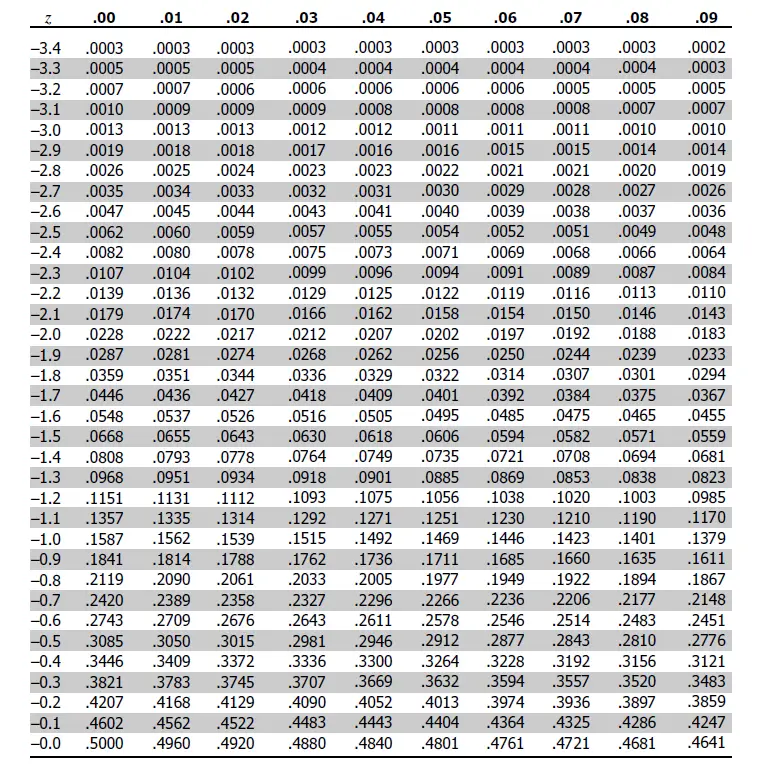
Find values on the left of the mean in this negative Z score table. Table entries for z represent the area under the bell curve to the left of z. Negative scores in the z-table correspond to the values which are less than the mean. |
|
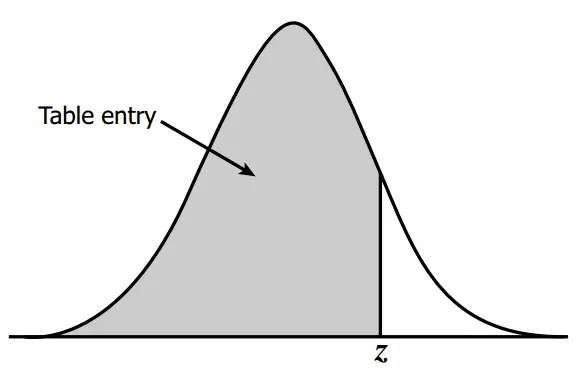
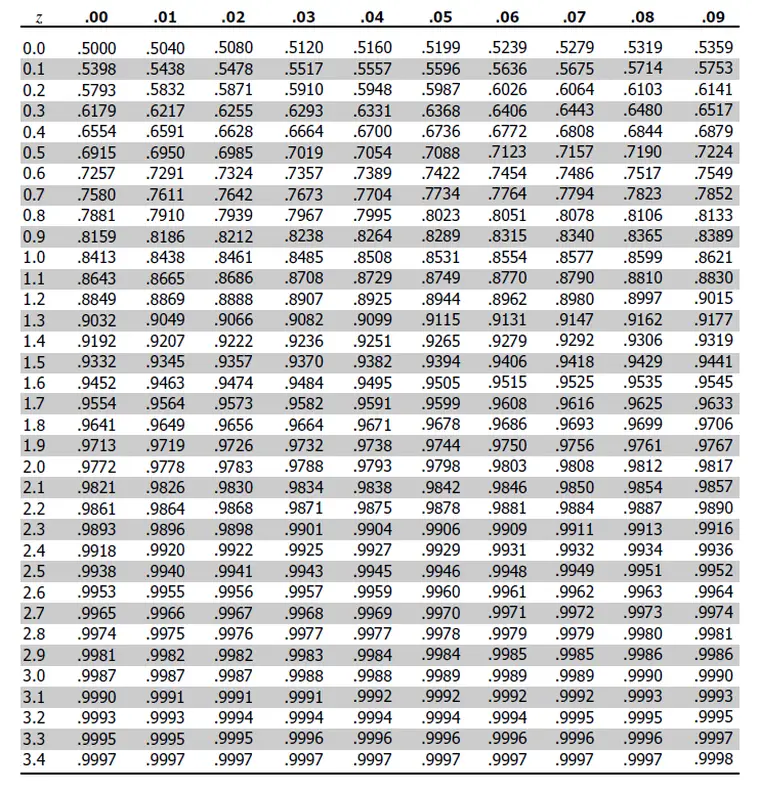
Find values on the right of the mean in this z-table. Table entries for z represent the area under the bell curve to the left of z. Positive scores in the Z-table correspond to the values which are greater than the mean. |
If you need to quickly calculate z score probabilities for a specific z score given a probability level please use a z score probability calculator below.
Z Score Probability Calculator
This calculator helps you calculate the probability associated with a given z-score. To use this calculator, follow these simple steps:
- Enter the z-score value in the "Enter z-score" field.
- Enter the probability level in the "Enter probability level" field.
- Click the "Calculate" button.
- The left tail probability and right tail probability associated with the given z-score will be displayed in the "Left tail probability" and "Right tail probability" fields respectively.
Z-Score Probability Calculator
Result
Left tail probability:
Right tail probability:
Z Score Calculation and Z Table Application Example
Here is an example of how a z-score applies to a real life situation and how it can be calculated using a z-table. Imagine a group of 200 applicants who took a math test. George was among the test takers and he got 700 points (X) out of 1000. The average score was 600 (µ) and the standard deviation was 150 (σ). Now we would like to know how well George performed compared to his peers.
We need to standardize his score (i.e. calculate a z-score corresponding to his actual test score) and use a z-table to determine how well he did on the test relative to his peers. In order to derive the z-score we need to use the following formula:
We need to standardize his score (i.e. calculate a z-score corresponding to his actual test score) and use a z-table to determine how well he did on the test relative to his peers. In order to derive the z-score we need to use the following formula:
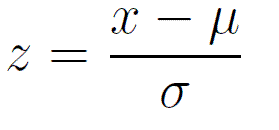
Therefore: Z score = (700-600) / 150 = 0.67
Now, in order to figure out how well George did on the test we need to determine the percentage of his peers who go higher and lower scores. That’s where z-table (i.e. standard normal distribution table) comes handy. If you noticed there are two z-tables with negative and positive values. If a z-score calculation yields a negative standardized score refer to the 1st table, when positive used the 2nd table. For George’s example we need to use the 2nd table as his test result corresponds to a positive z-score of 0.67.
Finding a corresponding probability is fairly easy. Find the first two digits on the y axis (0.6 in our example). Then go to the x axis to find the second decimal number (0.07 in this case). The number is 0.7486. Multiply this number by 100 to get percentages. So 0.7486 x 100 = 74.86%. This means that almost 75% of the students scored lower than George and only 25% scored higher. 75% out of 200 students is 150. George did better than 150 students.
Z-score Calculator
By Z-Table.com
Z Score Frequently Asked Questions
Q: What is a z-score?
A: A z-score is a statistical measure that tells us how many standard deviations a data point is from the mean of a dataset. The z-score is obtained by taking the difference between the data point and the mean, and dividing it by the standard deviation.
Q: Why are z-scores useful?
A: Z-scores are useful because they allow us to compare data points from different datasets that have different scales and units of measurement. By standardizing the data, we can make meaningful comparisons and identify outliers and extreme values.
Q: How do you interpret a z-score?
A: A z-score of 0 indicates that the data point corresponds to the mean. When the z-score is positive, it signifies that the data point lies above the mean, and when the z-score is negative, it denotes that the data point is below the mean. Furthermore, the magnitude of the z-score quantifies the distance between the data point and the mean in terms of standard deviations.
Q: What is a good z-score?
A: A z-score of +/- 1.96 or greater is considered statistically significant at the 5% level of significance (i.e., p < 0.05). This means that the data point is significantly different from the mean at a 95% confidence level.
Q: How do you calculate a z-score in Excel?
A: You can calculate a z-score in Excel using the formula: = (data point - mean) / standard deviation. For example, if your data point is in cell A1, and your mean and standard deviation are in cells B1 and C1, respectively, the formula would be: =(A1-B1)/C1.
Q: Can a z-score be negative?
A: Yes, a z-score can be negative if the data point is below the mean. This means that the data point is below average and further away from the mean in the negative direction.
Q: How do you use z-scores to identify outliers?
A: Z-scores can be used to identify outliers by looking for data points that are more than 3 standard deviations away from the mean. These data points are considered to be extreme values and may be due to measurement error or other factors that are not representative of the dataset as a whole.
Q: What is the relationship between z-scores and normal distribution?
A: Z-scores are used in conjunction with the normal distribution to standardize and compare data across different datasets. The normal distribution is a probability distribution that is often used to model real-world phenomena, and z-scores allow us to convert any normal distribution into a standard normal distribution with a mean of zero and an SD (standard deviation) of one.
Z Score Sample Problems and Answers
Z-scores are a powerful tool for analyzing data by standardizing the data points to a common scale. Here are some common z-score problems with detailed explanations:
Problem 1:
The mean height of a group of students is 65 inches, with a standard deviation of 3 inches. What is the z-score for a student who is 70 inches tall?
Solution: To find the z-score, we use the formula: z = (x - mean) / standard deviation. Plugging in the values, we get:
z = (70 - 65) / 3 = 1.67
The z-score for a student who is 70 inches tall is 1.67, which means that this student's height is 1.67 standard deviations above the mean height of the group.
Problem 2:
A company has 100 employees, with an average salary of $50,000 and a standard deviation of $5,000. What is the z-score for an employee who earns $60,000?
Solution: To find the z-score, we use the formula: z = (x - mean) / standard deviation. Plugging in the values, we get: z = (60,000 - 50,000) / 5,000 = 2 The z-score for an employee who earns $60,000 is 2, which means that this employee's salary is 2 standard deviations above the average salary of the company.
Problem 3:
A survey of 250 people found that the average income of the participants was $50,000, with a standard deviation of $10,000. What is the z-score for a participant who earns $70,000?
Solution: To find the z-score, we use the formula: z = (x - mean) / standard deviation. Plugging in the values, we get: z = (70,000 - 50,000) / 10,000 = 2 The z-score for a participant who earns $70,000 is 2, which means that this participant's income is 2 standard deviations above the mean income of the group.
